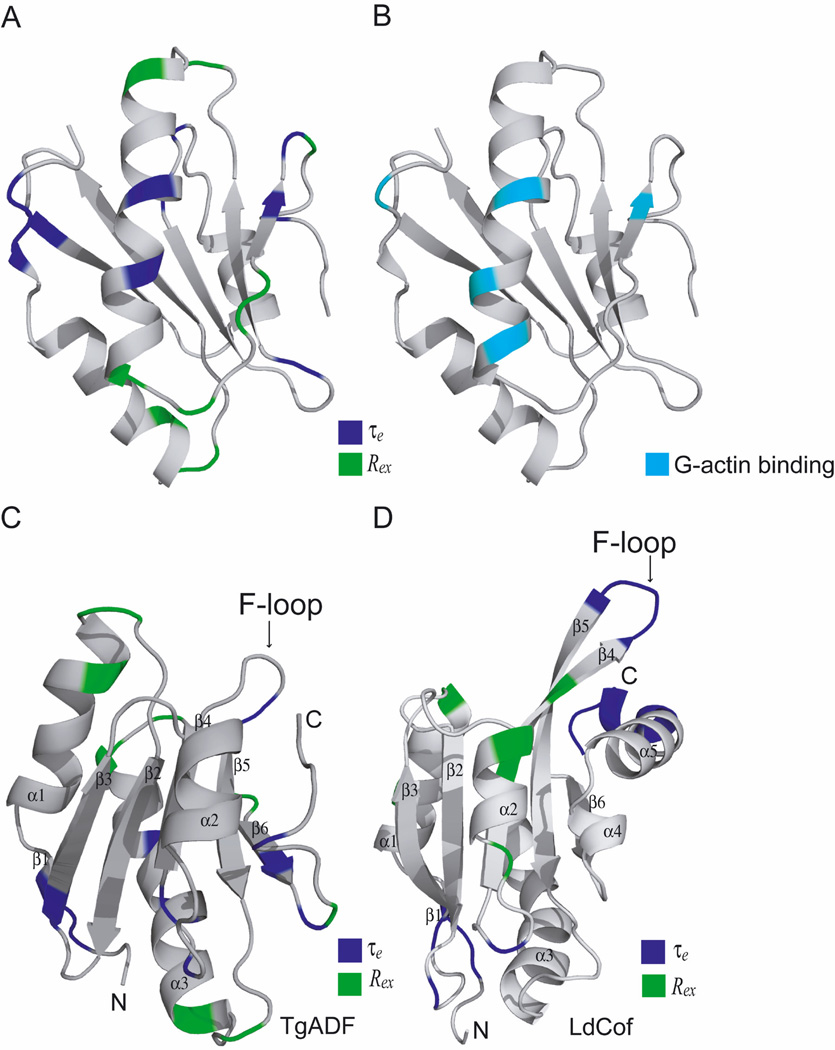
Figure 8.
(A) The ribbon representation of TgADF lowest energy structure shaded according to chemical exchange term (Rex) shaded in green and effective correlation time (τe) shaded in blue obtained from model free analysis. (B) Residues involved in hydrogen bonding with G-actin in the TgADF-actin docked model are shaded in cyan. (C) As described for Fig. 8 A with labeled F-loop. (D) The ribbon representation of LdCof lowest energy structure shaded according to chemical exchange term (Rex) and effective correlation time (τe) obtained from model free analysis. Color pattern is similar as for TgADF.

