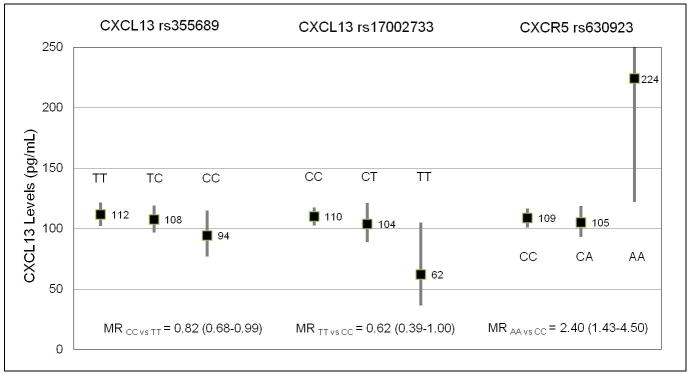
Figure 3. CXCL13 levels by CXCL13 and CXCR5 tagSNPs.

Geometric mean values of serum CXCL13 (pg/mL) in cases and controls by genotypes (black boxes) with 95% confidence intervals (bars) for three tagSNPs: CXCL13 rs355689, CXCL13 rs17002733, and CXCR5 rs630923. Adjusted mean ratios (MRs) and 95% confidence intervals are indicated for each tagSNP for homozygote minor allele carriers versus major allele homozygote carriers.
