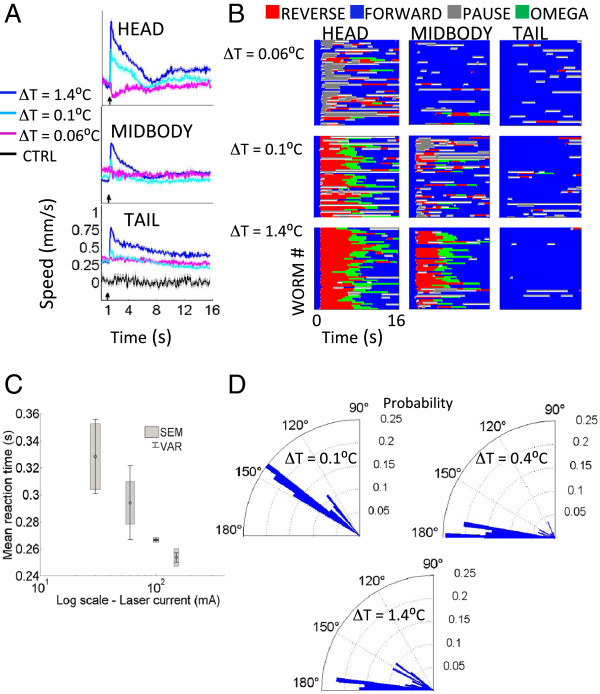
Figure 2.
Spatial high-content phenotyping of N2 thermal noxious response. (A) The mean centroid speed as a function of time quantifies the dose-dependent differences for the head, midbody and tail responses. Laser is fired at 1 s (arrow). The control speed (CTRL) is offset by 0.25 mm/s for clarity. Shaded regions are SEMs. N > 50 for all ∆T > 0°C, N = 15 for CTRL. Axes for head and middle are the same as tail. (B) Ethograms separated by stimulation region (head, body, tail) for selected ∆T demonstrate the evolution of the behavioral states over time, and show the spatial and thermal variation of the response. (C) The reaction time of the worm in response to a head-applied laser stimulus as a function of laser power. (D) The probability distribution of the escape angle as the worm responds to a head-applied laser stimulus.

