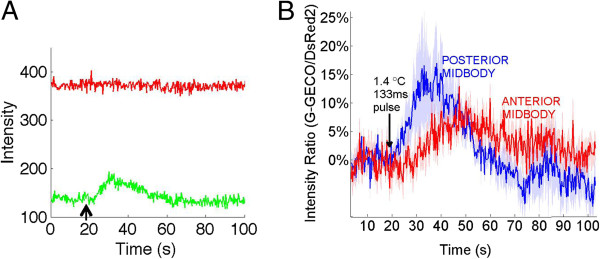
Figure 7.

The PVD neurons show a spatially dependent response to localized noxious heat pulses at the midbody. A) Sample raw data of G-GECO 1.2 calcium indicator in PVD (green line) and DsRed2 reference chromophore in PVD (red line) during data acquisition, IR pulse at arrow. B) Calcium response to IR laser pulse at the midbody for anterior (red line) and posterior (blue line) stimulation. Solid lines represent the average normalized ratio of G-GECO 1.2 emission to DsRed2 emission in PVD for N = 8 anterior midbody recordings and N = 7 posterior midbody recordings. The arrow is where the IR pulse is applied. Shaded region is SEM.
