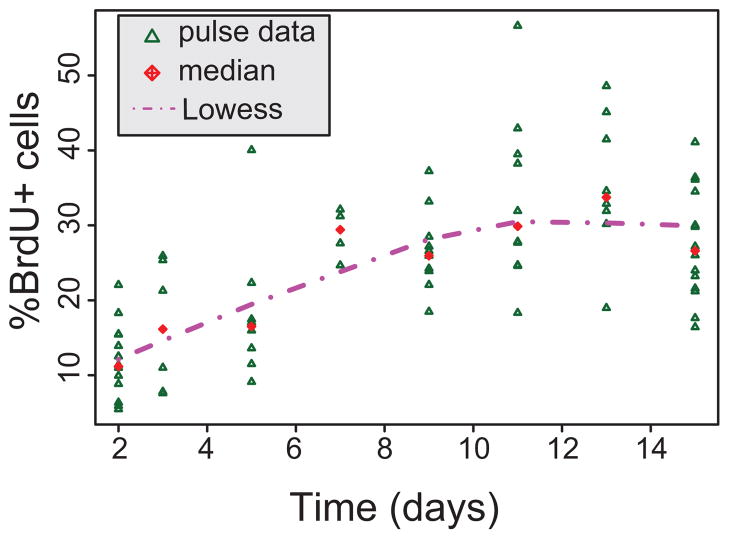
Figure 1. Determination of minimal sufficient length of labeling phase.
All pulse data, expressed as the percentage of tumor cells that are BrdU-positive (%BrdU+). Times shown are the days since the first dose of BrdU administration began. We attempted to test a mono-exponential and a bi-exponential model for the pulse data, but the time period was insufficient to distinguish between the two models.

