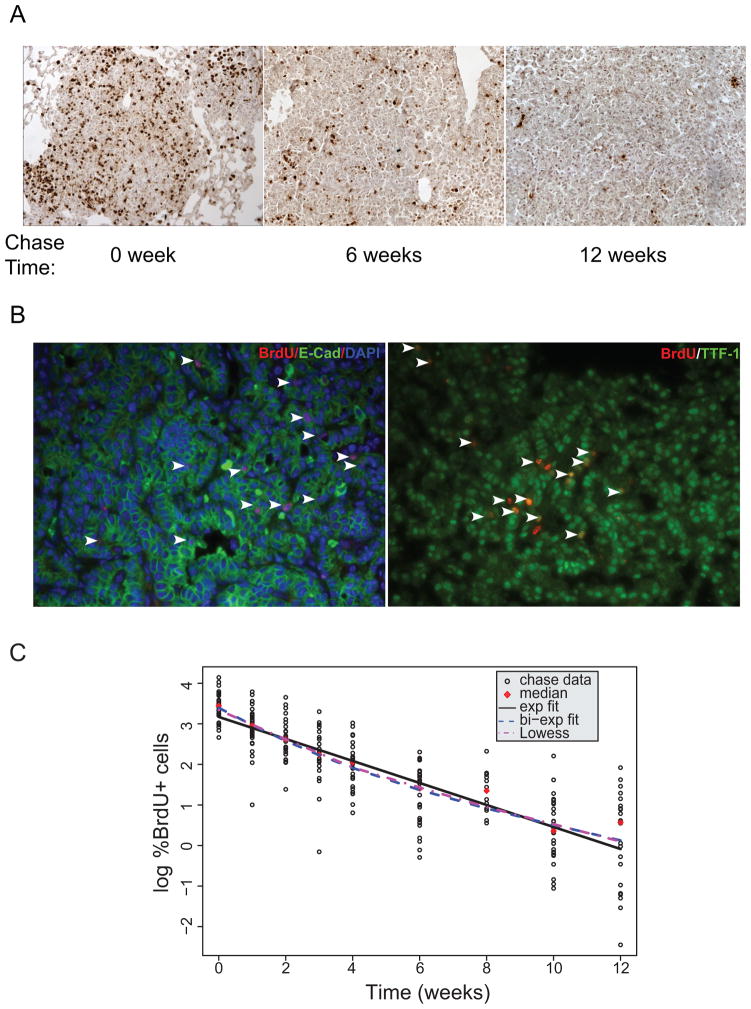
Figure 2. Detection of BrdU+ cells through a pulse-chase experiment.
A. Representative examples of BrdU staining of mice at the indicated time points during the “chase” phase. B. Representative co-immunofluorescence staining of BrdU and epithelial markers E-Cadherin or TTF-1 at the end of “chase” phase. C. All chase data, expressed as the percentage of tumor cells that are BrdU-positive, in a log-linear plot. Time “0” represents when BrdU administration for chase experiment stopped.

