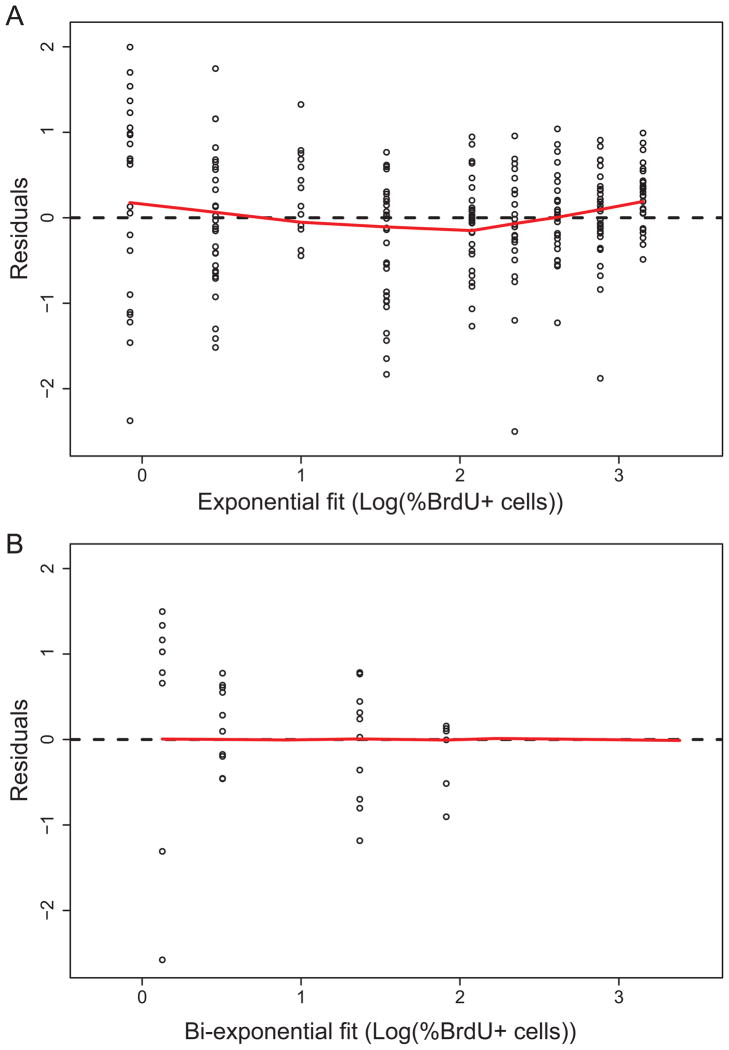
Figure 3. Residual analysis for exponential and bi-exponential models.
A. Residuals for the exponential model, with a proportional error structure, fit to chase data. The red curve is a lowess fit. B. Residuals for the bi-exponential model, with a proportional error structure, fit to chase data. The red curve is a lowess fit.

