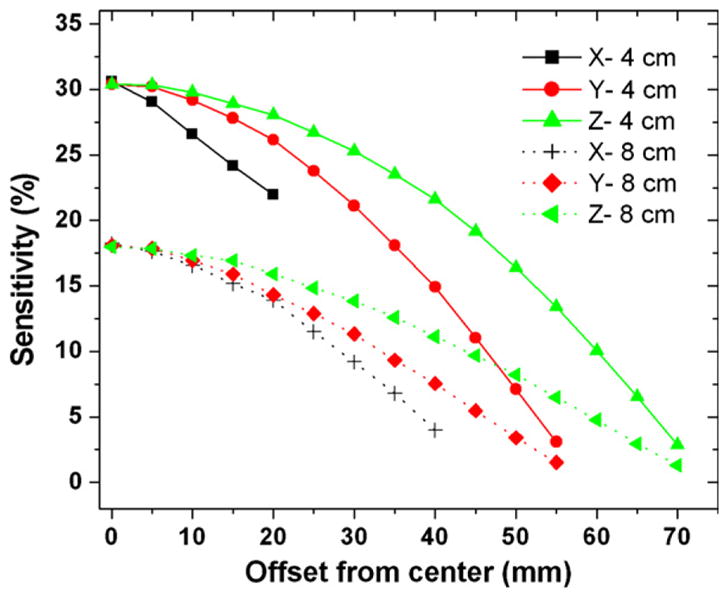
Figure 3.

System photon sensitivity with a point source at the system center as a function of the distance (mm) from the center along the X, Y, Z directions for 4 cm (top curves) and 8 cm (bottom curves) panel separation. For these studies the energy window is 6% (496–526 keV) centered on 511 keV and the coincidence time window is 16 ns. For 8 cm panel separation, the FOV is larger so that it has more data points along the X direction. See figure 1 for definition of the axes.
