Figure 5.
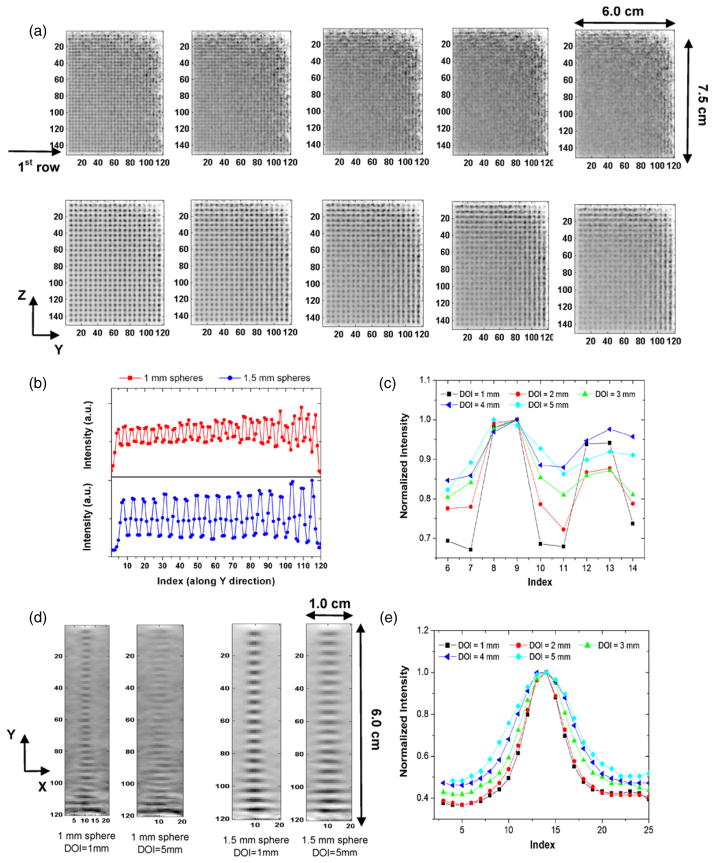
(a) In-plane (parallel to panels) reconstructed image slices through warm spheres in cold background with varying DOI resolution for 1.0 mm (top) and 1.5 mm (bottom) diameter spheres. Pixel size: 0.5 mm. The simulated spheres were placed on a plane midway between the two panels which were separated by 4 cm. From the left to the right, the DOI resolution is varied from 1 mm to 5 mm in 1 mm increments. (b) 1D profile for the first row in each quadrant in YZ plane, which corresponds to the in-plane sphere resolution. (c) The 1D profile crossing the second and third sphere along the 1D profile in (b) and the peak-to-valley ratio (PVR) is calculated for two peaks, as a function of the five DOI resolution values. (d) Orthogonal-plane (perpendicular to panels, XY plane) images for the first row in each quadrant with a DOI resolution of 1 mm and 5 mm. (e) the 1D profile of the topmost sphere in (d) for 1.5 mm diameter spheres, which corresponds to the orthogonal-plane sphere resolution.

