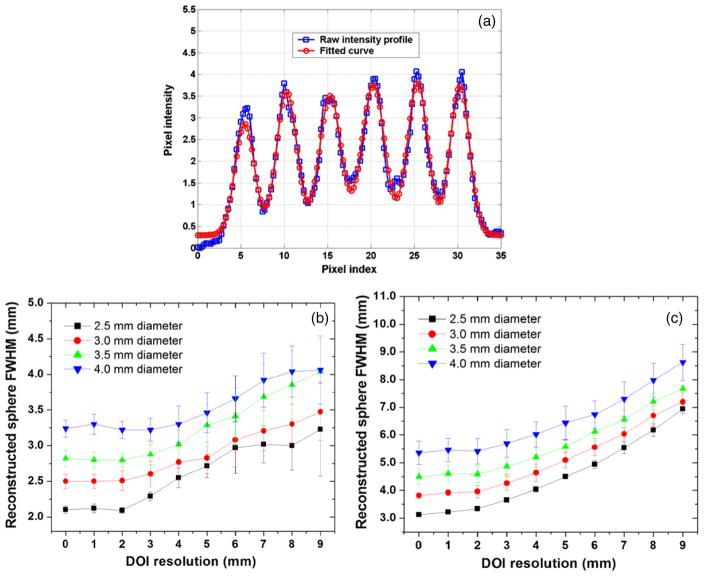
Figure 7.
Results from analysis of spatial resolution studies. (a) In each quadrant of the in-plane (parallel to panels) slice through the reconstructed six spheres (see figure 6(a)), the 1D profile of the first row (row index = 1) was fitted with six Gaussian distributions on top of a linear background. (b) The reconstructed in-plane sphere FWHM as a function of the DOI resolution. (c) The reconstructed orthogonal-plane (perpendicular to panels) sphere FWHM as a function of the DOI resolution. The analysis was not performed for the 1.0 mm and 1.5 mm spheres (figure 5) since the reconstructed pixel size of 0.5 mm limited the number of samples available for fitting.

