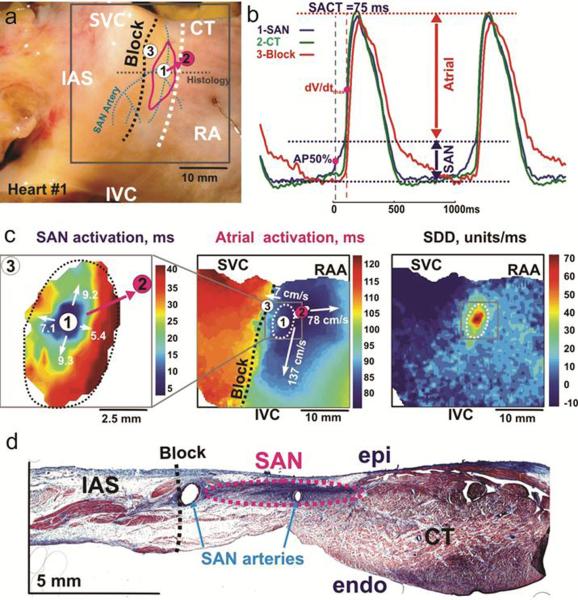
Fig. 1.
a Epicardial aspect of a perfused SAN preparation. The three dashed lines are: black for block zone, white for sulcus terminalis, blue for SAN arteries. The solid pink line demarcates the location of the SAN. The solid circles are atrial exit breakthrough points recorded in all preparations, the pink circle is the intrinsic breakthrough point of this preparation b Optical APs from SAN (blue), breakthrough point in CT (green) and block zone (red) during intrinsic sinus rhythm (cycle length 1070ms). Several components to the APs reflect superimposed signals from overlying areas. The SAN component is smaller than the atrial one c Separate activation maps of the SAN and right atrium allow tracking of the exit pathway. Also shown here a slow diastolic depolarization (SDD) map of the right atrium d Histological section through the SAN demonstrating surrounding connective tissue layers and presence of arterial branches at the block zone. AP50%: 50% of SAN AP amplitude, dV/dtmax: maximum derivative of atrial upstroke, IVC: inferior vena cava, SVC: superior vena cava, RAA: right atrial appendage, epi: epicardium, endo: endocardium (Reproduced from Fedorov et al. [27] with permission).

