
Fig. 2.
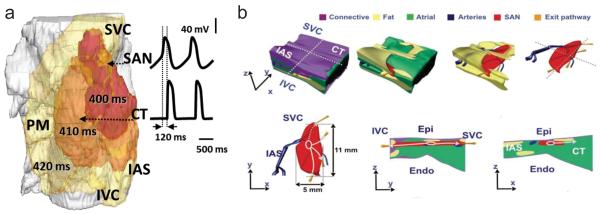
a Activation sequence simulated with the 3D human SAN model by Chandler et al. Snapshots of membrane potential isosurface V=−30 mV in the semi-transparent tissue are shown at 400, 410 and 420 ms, along with time courses of the membrane potential in the SAN and CT. Conduction time between the earliest excitation in the SAN and the earliest atrial activation in the CT is ~120 ms, after which the excitation rapidly spreads through the atrial tissue b Anatomical model of the human SAN based on histological reconstruction and incorporating functional sino-atrial exit pathways (gold), shown in different projections. Surrounding tissues are: connective tissue (purple), fat (yellow), atrial muscle (green) and arteries (blue). SAN: sinoatrial node, CT: crista terminalis, PM: pectinate muscles, IAS: inter-atrial septum, SVC: superior vena cava, IVC: inferior vena cava, Epi: epicardium, Endo: endocardium (Fig. 2b reproduced from Fedorov et al. [27] with permission)