


Fig. 2. GIT1 protein expression was highly regulated in vivo and in vitro.
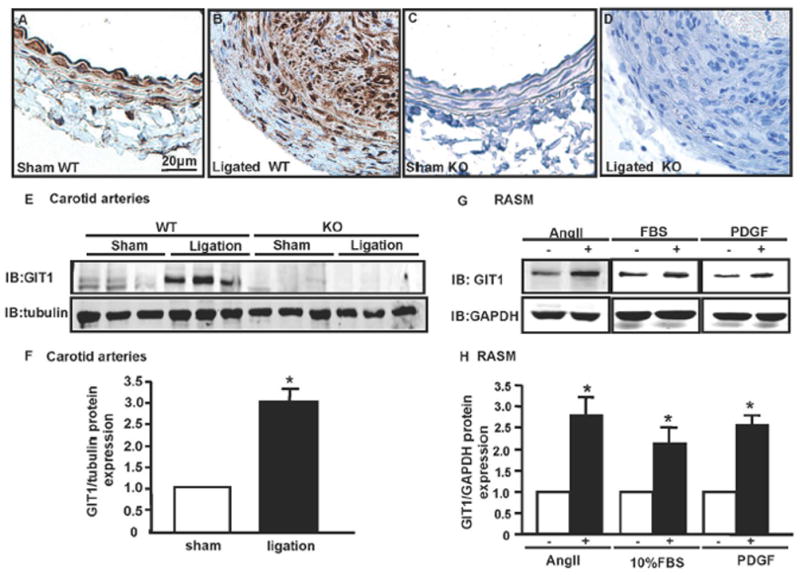
A–D. Immunostaining of GIT1 in carotid arteries of WT and KO mice 14 days after sham or ligation. GIT1 is highly expressed in the intima. Bar=20μm. E. Immunoblot of GIT1 expression in carotid arteries in GIT1 WT and KO mice 7 days after ligation. F. Quantification of GIT1 relative expression normalized to tubulin (Sham = 1.0). *p< 0.05 compared with sham group (mean ±SE; n =3). G. RASM were cultured in serum-free medium for 24h, then treated with and without AngII (10−7 m/L), PDGF (10ng/ml) and 10% FBS for 24h. GIT1 expression was detected by western blot. H. Quantification of GIT1 relative expression normalized to GAPDH (control = 1.0). *p< 0.05 compared with control group (mean ±SE; n =3).