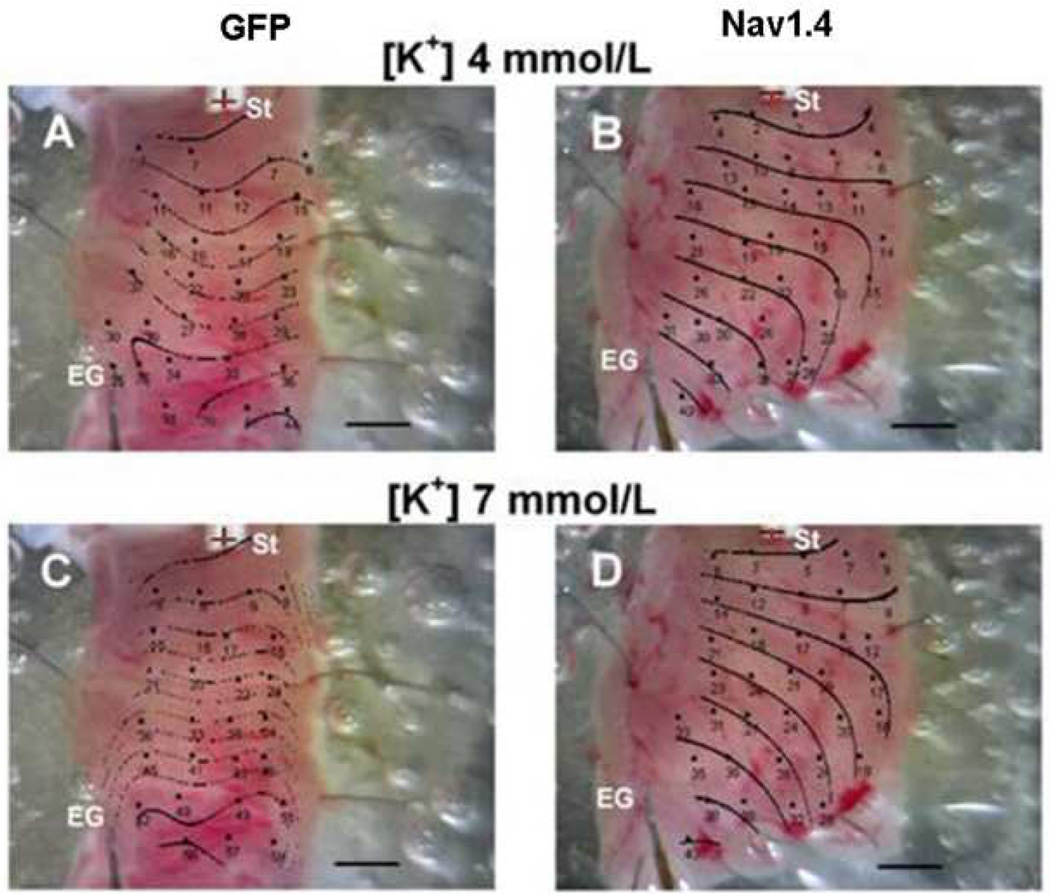
Figure 2.
Representative activation maps superimposed on photographic images of tissue slabs excised from the infarct zones of Nav1.4 dogs (right panels) and GFP-injected control dogs (left panels). Panels A and C: activation patterns of the tissue superfused with [K+] 4 mmol/L. Panels B and D: superfusion with [K+] 7 mmol/L. Dots indicate microelectrode impalement sites. Numbers are activation times relative to the stimulus artifact. St: Stimulus site. EG: reference electrogram site. Horizontal scale 2 mm; interval between isochrones 5 ms.

