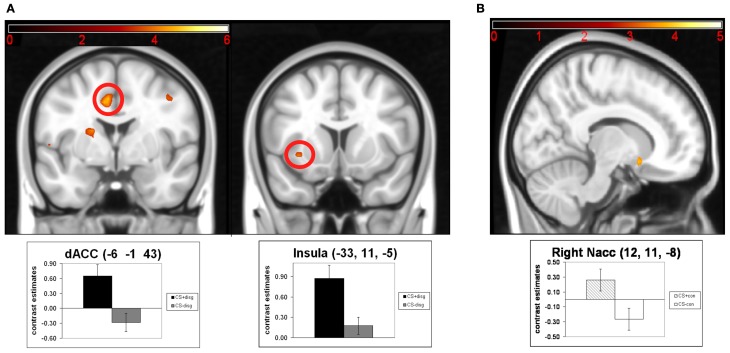
Figure 3.
Results of the paired t-tests of the separate analysis of conditioned responses in the counterconditioning and the control conditions: (A) neuronal activations for the contrast CS+disg minus CS-disg; (B) neuronal activations for the contrast CS+con minus CS-con. Mean contrast estimates (and standard errors of the mean) of the CS in the respective peak voxels are illustrated in the bar graphs. The threshold for displaying the images is set at puncorr < 0.005 and k > 5 voxels.

