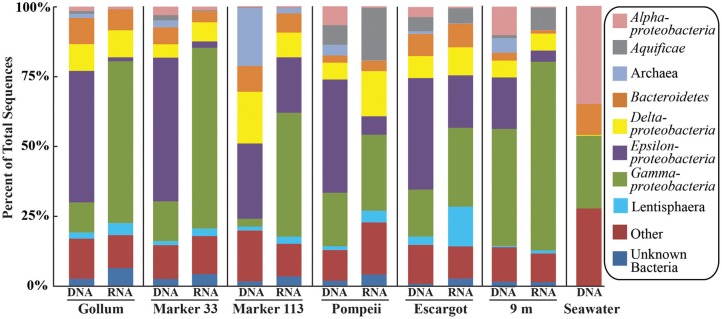
Figure 3.

Taxonomic breakdown and relative abundance at the phylum (and class for Proteobacteria) level for the 96% 16S rRNA gene OTUs in all samples. Only those taxa that occurred more than 3% in any individual dataset are included. Taxa that occurred less than 3% are placed into “Other.”
