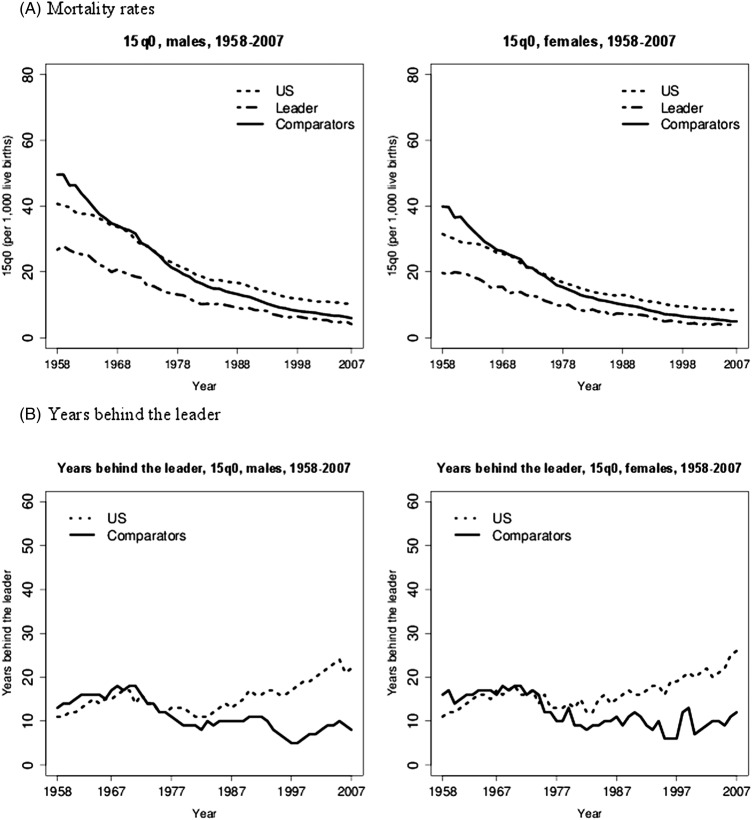
Figure 3.
Evolution of mortality rates (A) and years behind the leader (B) in the 0–14 age group, for the leader, the USA, and the average of 16 comparator high-income countries, males and females, 1958–2007. Note: 15q0 is defined as the probability of dying from birth through age 14 at the then prevailing age-specific mortality rates.

