Figure 1.

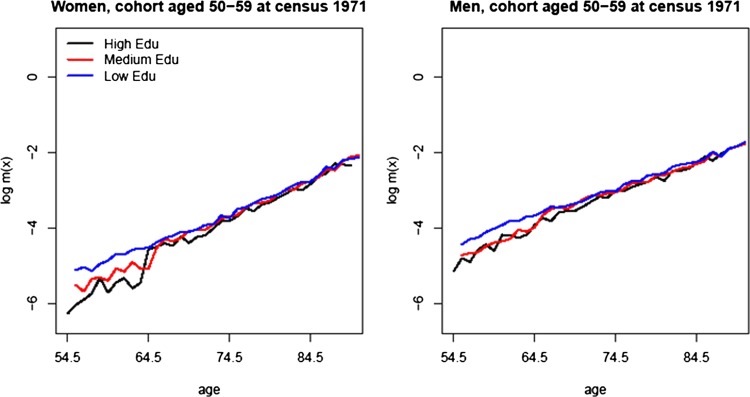
Death rates on logarithmic scale for the birth cohort aged 50–59 at the beginning of the follow-up (1971) by three education levels: high, medium and low.

Death rates on logarithmic scale for the birth cohort aged 50–59 at the beginning of the follow-up (1971) by three education levels: high, medium and low.