
Fig. 4.
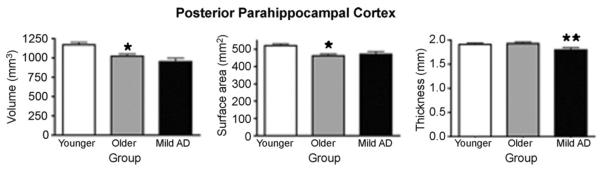
Bar graph illustrating morphometric differences of PPHC volume, surface area, and cortical thickness between Normal Younger, Normal Older, and Mild AD groups. Measurements displayed were obtained from the average of both hemispheres. Error bars represent standard error. The legend used is identical to the one used in Fig. 2.