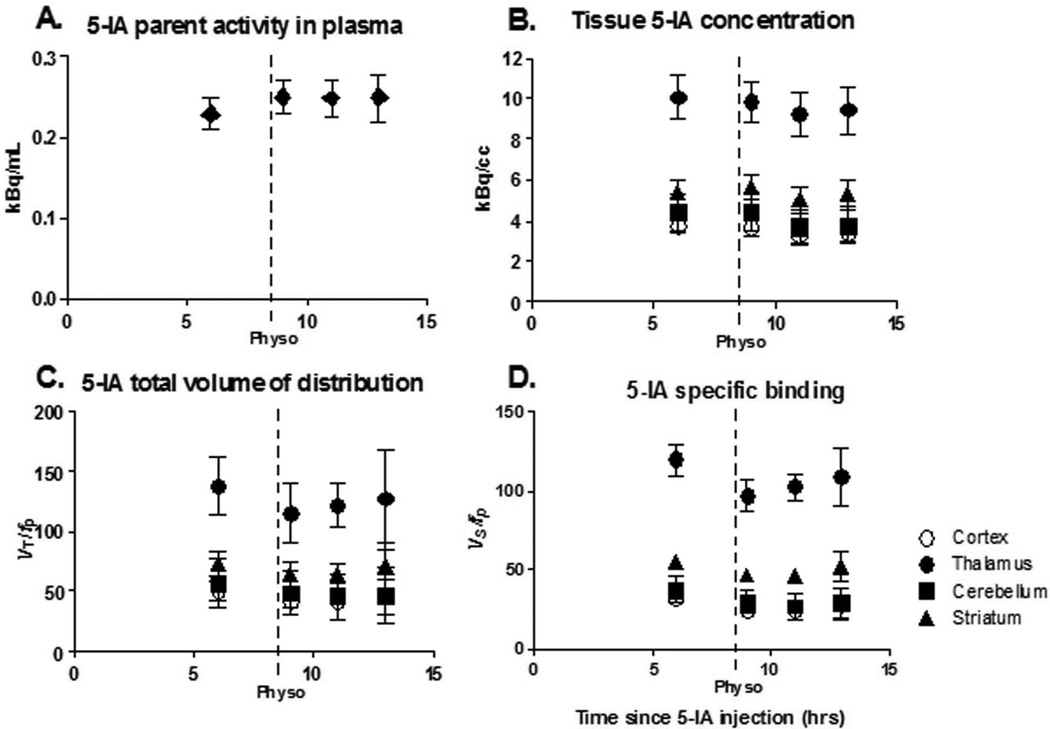
Figure 1.
The first point in each graph represents baseline data obtained starting 6 h after beginning tracer infusion when a state of equilibrium is achieved, and provided the baseline specific binding. Following completion of the baseline scans, physostigmine was administered I.V. (1.0–1.5 mg over 1 h, arrow). At the onset of the physostigmine infusion, scanning was resumed for up to 9 h. Bars represent standard error of the mean (SEM). A. Plasma [123I]5-IA concentration (kBq/mL) (total parent) measured during [123I]5-IA constant infusion in healthy volunteers. Following physostigmine administration there was a significant 8% increase in mean plasma [123I]5-IA concentration as compared to before physostigmine administration. B. Tissue [123I]5-IA concentration (kBq/cc) in thalamus (circles), striatum (triangles), cortex (open circles), and cerebellum (squares) measured during [123I]5-IA constant infusion. We observed 7–15% region specific decrease in [123I]5-IA tissue concentration after physostigmine challenge. C. [123I]5-IA total volume of distribution (VT/fp) in thalamus (circles), striatum (triangles), cortex (open circles), and cerebellum (squares) measured during [123I]5-IA constant infusion. VT/fp values measured after the physostigmine infusion were significantly reduced (14–18% region specific) compared to the baseline values. D. [123I]5-IA specific binding (BPf) in thalamus (circles), striatum (triangles), cortex (open circles), and cerebellum (squares) measured during [123I]5-IA constant infusion. BPf values measured after the physostigmine infusion were significantly reduced (19–36% region specific) compared to the baseline values.

