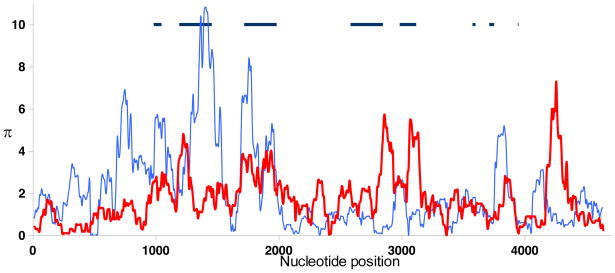
Fig. 4. Nucleotide diversity (Π) in HLA-B and -C genes.
The vertical axis shows Π (%) measured in 100 bp windows across 4.6 kb of aligned sequences consisting of 45 HLA-C (red line) and 19 HLA-B (blue line) sequences. The horizontal axis indicates the nucleotide position in the alignment. The approximate positions and sizes of protein-coding regions are indicated by horizontal dark lines (190).

