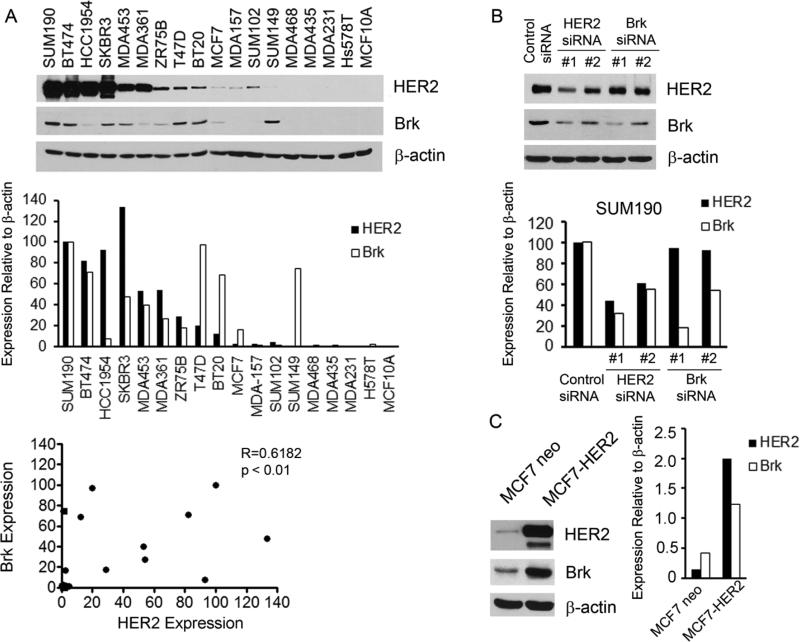
Fig. 1.
Correlation between the levels of Brk and HER2 in breast cancer cells. (A) A panel of 17 breast cancer cell lines and MCF10A nonmalignant mammary epithelial cells were analyzed by Western blotting with antibodies directed against Brk and HER2. β-actin served as a protein loading reference (top panel). Expression of Brk and HER2 relative to the internal control β-actin was quantified by ImageJ densitometry software and presented in a histogram (middle panel). Spearman analysis was used to analyze the correlation between Brk expression and HER2 expression in these cell lines (bottom panel). (B) SUM190 cells were transiently transfected with each of two different HER2- or Brk-specific siRNAs or control siRNA for 48 h. The cells were then lysed and analyzed by Western blotting with the indicated antibodies. Levels of Brk and HER2 relative to β-actin were quantified and presented as in A. (C) MCF7 cells stably expressing high levels of HER2 (MCF7-HER2) or a control vector (MCF7-neo) were lysed and analyzed by Western blotting with the indicated antibodies. Levels of Brk and HER2 relative to β-actin were quantified and presented as in A.

