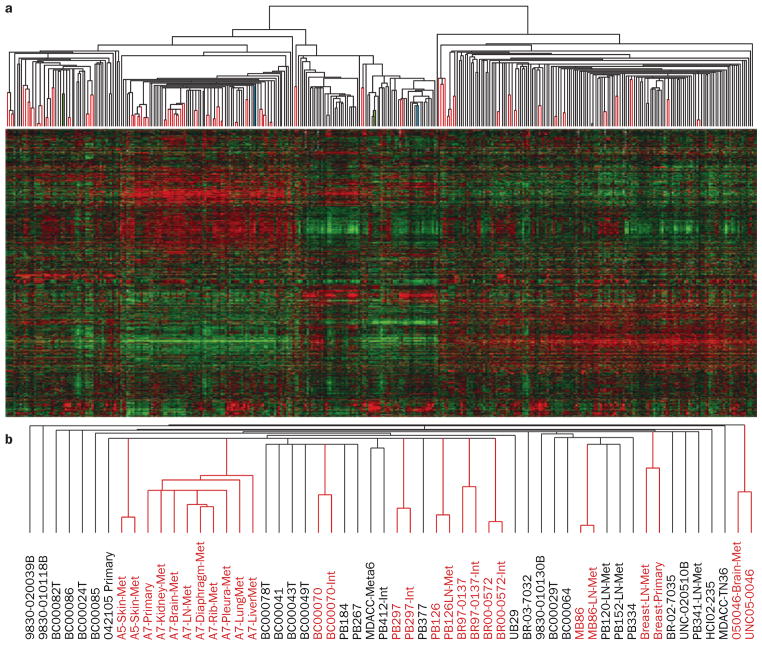
Figure 1.
Identification of tumor individuality using global gene-expression analyses. a | Supervised hierarchical clustering of breast cancer data from Harrell et al.112 of 367 breast samples using 1,900 intrinsic genes. Paired tumor samples are highlighted by the red lines in the array tree, with 41 out of 43 possible pairs being paired. The two paired samples that did not pair together are shown in green and light blue color. Note that one of each paired sample was a primary tumor sample that was present within the normal-like cluster, which suggests that both were highly contaminated with true normal breast tissue. b | A subset of the basal-like array tree showing the different array names. Note that some tumors had more than two samples, and in all cases, these were all grouped together. Abbreviations: INT, second partner of an intrinsic pair (that is, two distinct pieces of the same primary tumor); LN, lymph-node metastasis; Met, distant metastasis; Meta, metaplastic.

