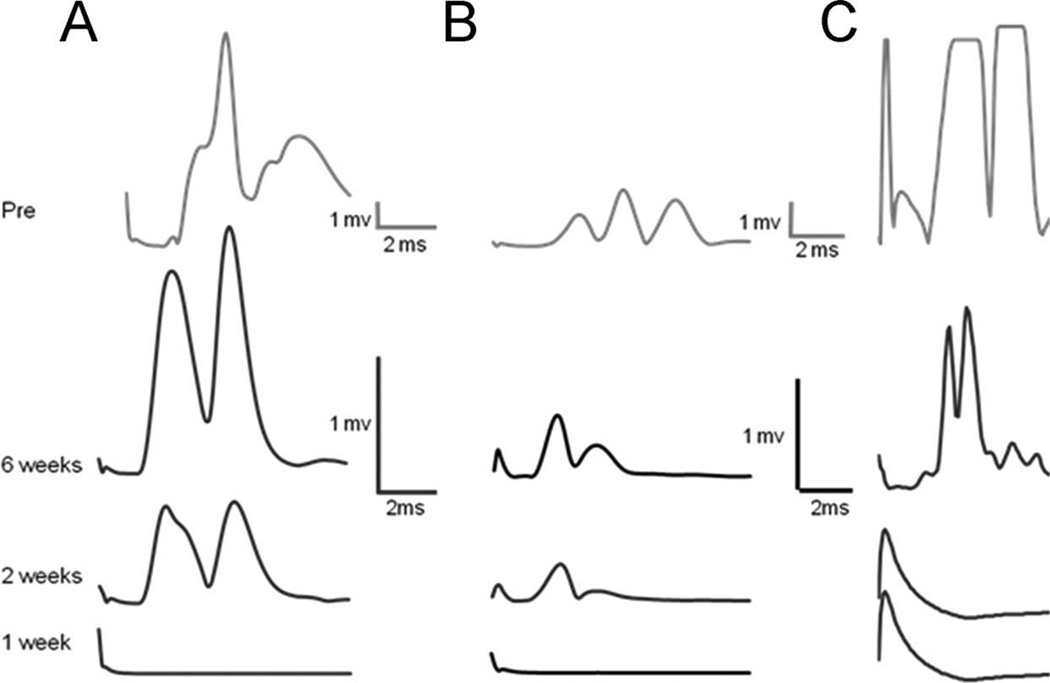
Figure 2.
Typical direct muscle (M) responses of Sol (A) and TA (B) in sES Treated rats and Sol (C) in Untreated rats, recorded in response to stimulation of the sciatic nerve in Intact rats (top row) and at 1, 2, and 6 weeks postoperative. These M-responses were absent in all muscles at 1 week postoperative and were seen in both muscles at 2 weeks, but only in Treated rats. By 6 weeks postoperative the amplitudes of the M-responses in both muscles had increased, although they were still less than preoperative values.

