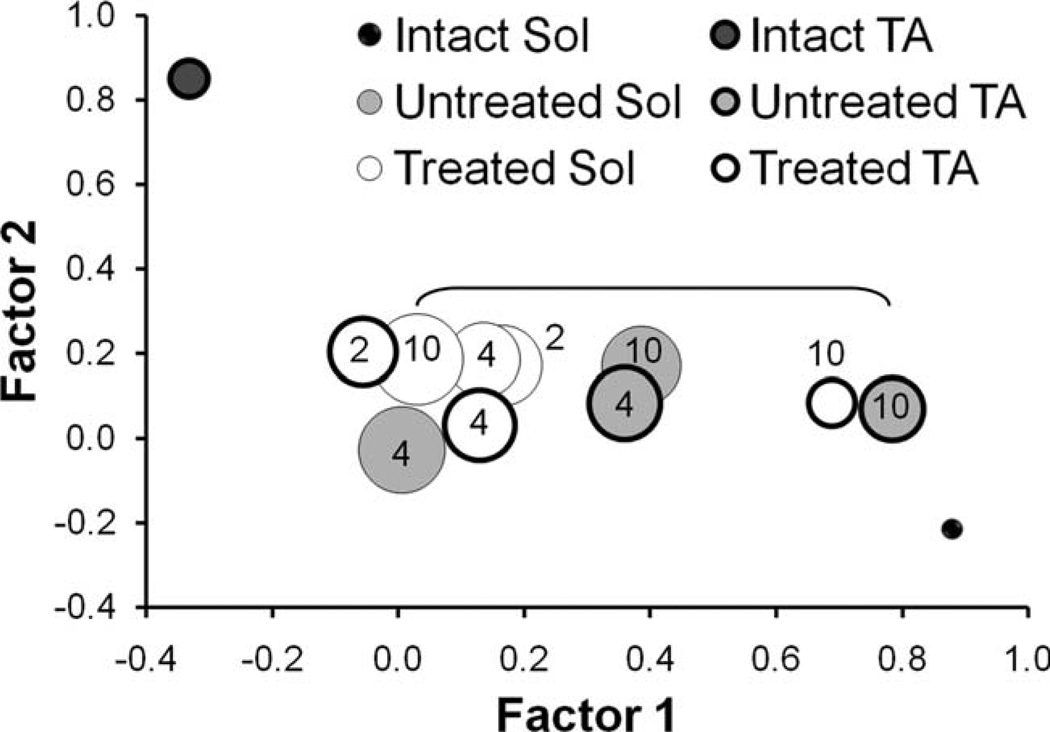
Figure 4.
Results of PCA of locomotor EMG activity. Scatterplot graph of factor 1 vs. factor 2 from Intact, sES Treated, and Untreated rats at different times following transection and surgical repair of the sciatic nerve is shown. Numeric text designations on or next to each point indicate the survival time in weeks. No point is represented for the untreated rats at 2 weeks because innervation had not occurred at that time. The size of the symbol is proportional to the SEM. At all survival times, either factor 1 or factor 2 was significantly different from both the Intact TA and SOL for all injured animals. The bracketed points for the Untreated TA and Treated SOL at the 10-week survival times are the only two paired comparisons that were significantly (P < 0.05) different.

