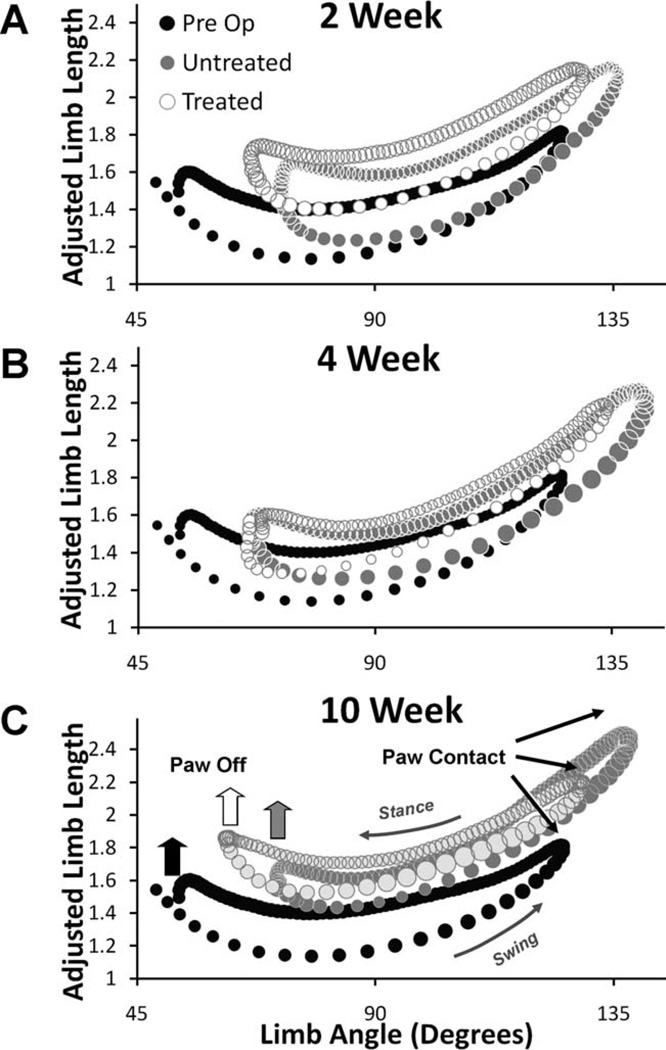
Figure 6.
In each panel, overall limb angle (abscissa) is plotted against adjusted limb length (ordinate). Data from Untreated (n = 4) and sES Treated (n = 6) rats are overlaid onto data from Intact rats (n = 8). Data points represent averages between rats of selected step cycles. Symbol size is proportional to the SEM. Data are from 2 weeks (A), 4 weeks (B), and 10 weeks (C) postoperative survival times.

