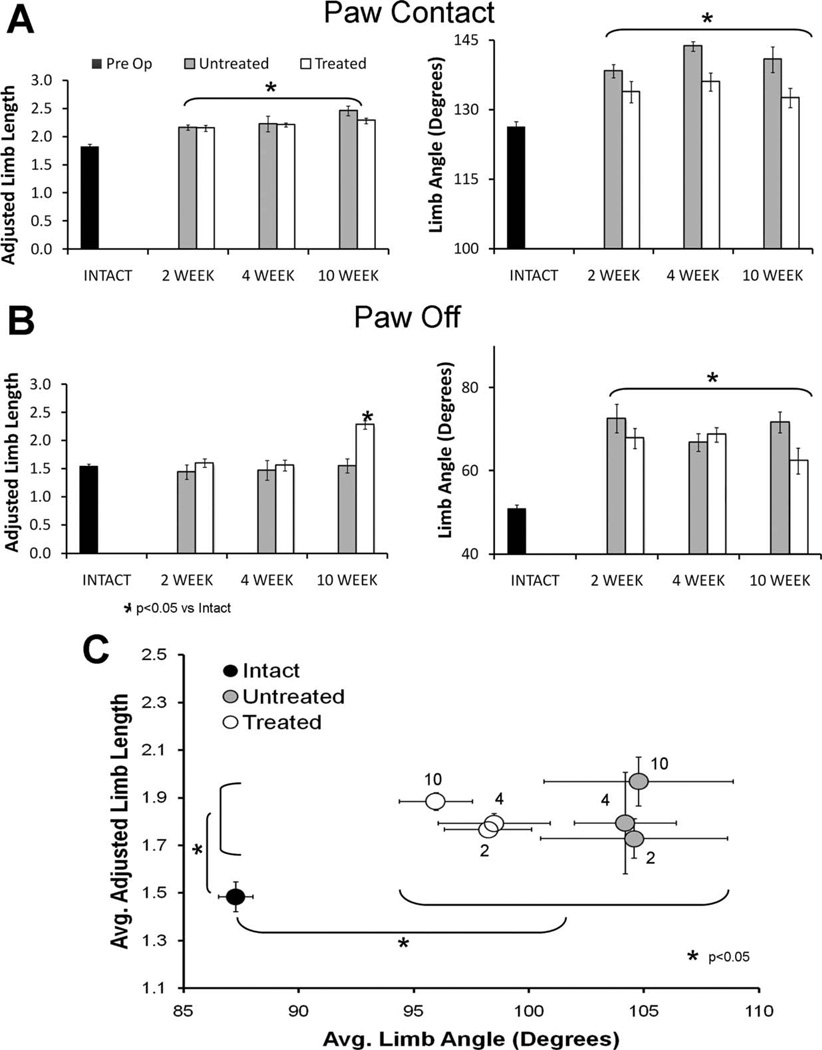
Figure 7.
A: Bar graph representation of adjusted limb length (left) and limb angle (right) at paw contact for Intact rats and sES Treated and Untreated rats studied at 2 weeks, 4 weeks, and 10 weeks postoperative survival times. B: Bar graph representation of adjusted limb length (left) and limb angle (right) at paw off (the end of stance) for Intact rats and sES Treated and Untreated rats studied at 2 weeks, 4 weeks, and 10 weeks postoperative survival times. C: Average median limb angle (6SEM) is plotted against average median adjusted limb length (±SEM) for Intact rats and sES Treated and Untreated rats studied at 2 weeks, 4 weeks, and 10 weeks postoperative survival times. Numbers next to the symbols indicate the survival time in weeks. Brackets indicate paired (Fisher’s least significant difference) comparisons that are significantly different (P < 0.05).

