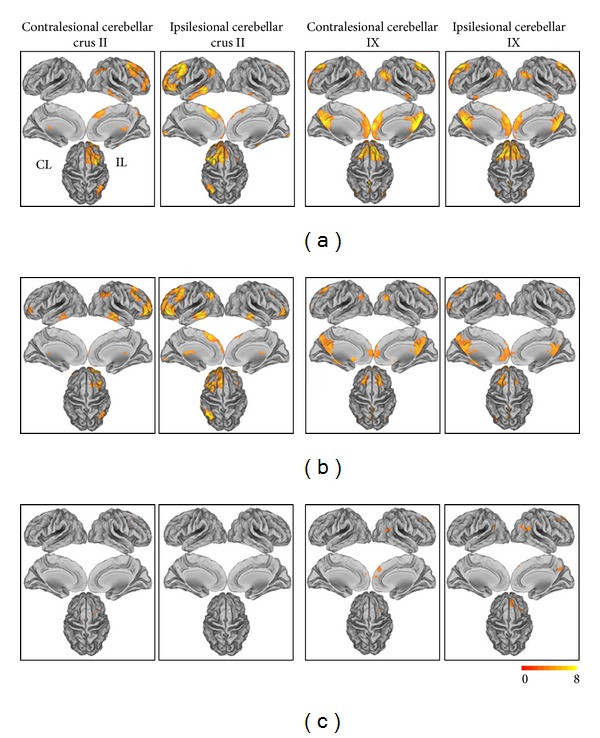
Figure 3.

The rsFC patterns of the cerebellar subregions in healthy controls and stroke patients (total: n = 25) and the rsFC differences between stroke patients and healthy controls (P < 0.05 corrected). (a) The rsFC patterns of the cerebellar subregions in healthy controls; (b) the rsFC patterns of the cerebellar subregions in stroke patients; (c) the differences in the rsFCs between stroke patients and healthy controls.
