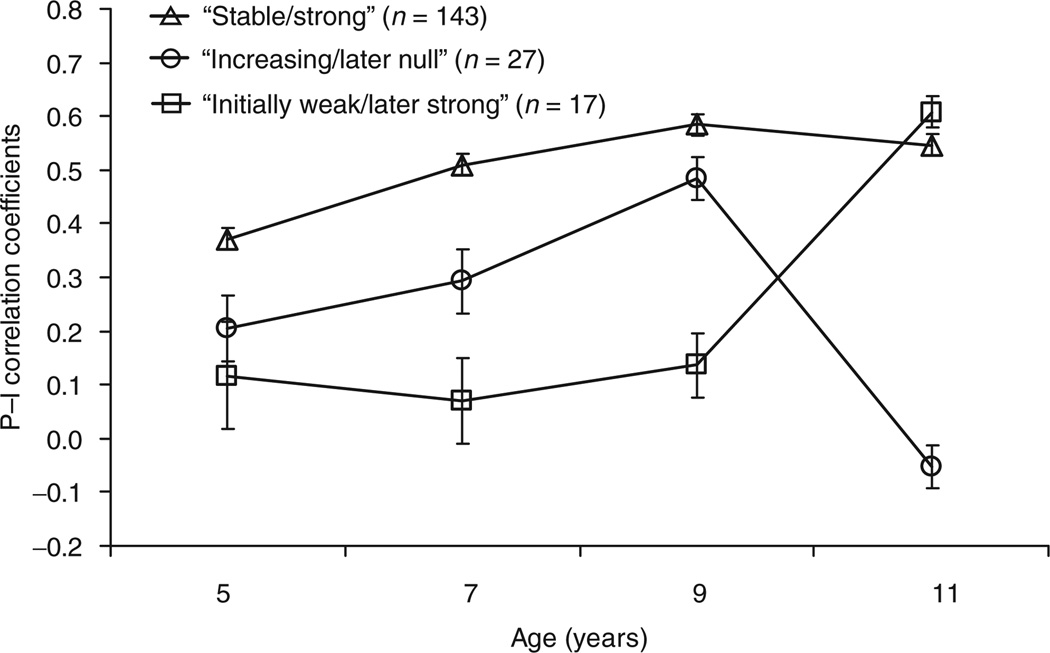
Figure 2.
Change in the predictive relation between snack food preferences and energy intake (kcal) of snack foods among girls from age 5 to 11 (n = 187). P−I correlations represent the association between food preferences and calorie intake; plotted values are means ± s.e.m. Three patterns in the P−I relation were identified by running a latent profile analysis on the P−I correlation coefficient data. In the “strong/stable” group (n=143), food preferences predicted intake from ages 5 to 11 and became stronger predictors with age; “increasing/later null” group (n = 27), food preferences were weak predictors of intake at age 5 and became better predictors with age, but stopped predicting intake at age 11; and, “initially weak/later strong” group (n = 17), food preferences were weak predictors of intake between ages 5 and 9, but became strong predictors at age 11.

