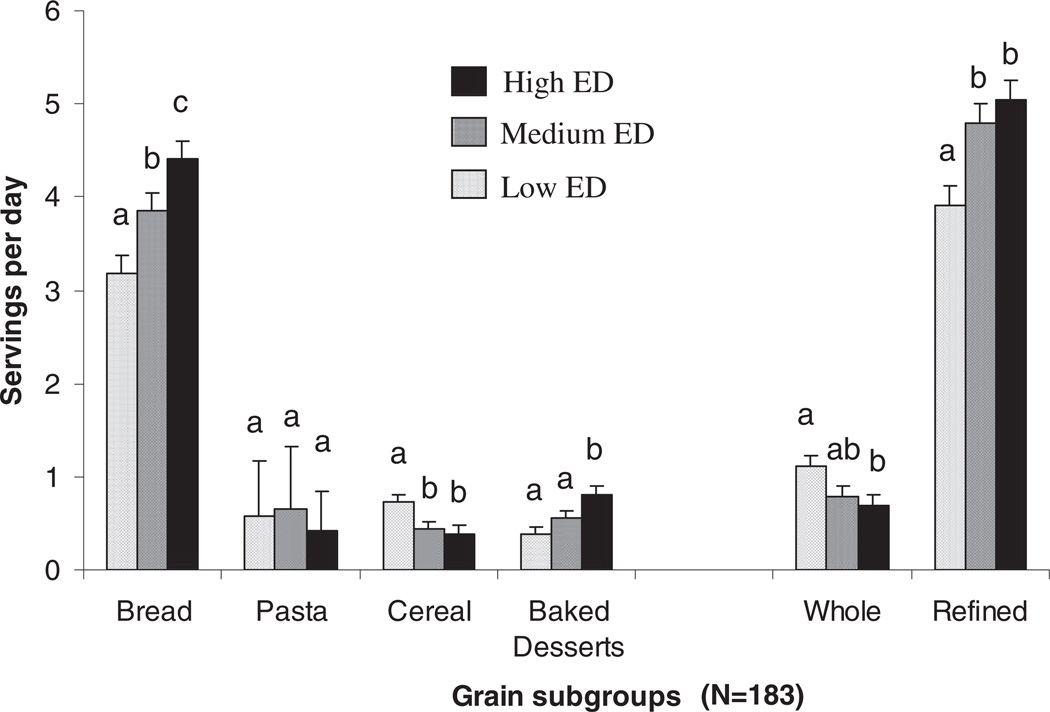
FIGURE 2.
Grain subgroup servings per day (x̄ ± SD) are based on the average of three 24-h dietary recalls by energy density (ED) group (n = 183). ED groups were identified by using tertile cutoffs: low-, medium-, and high-ED diets were defined by ED values <1.5 kcal/g, 1.5–1.85 kcal/g, and >1.85 kcal/g, respectively. Data were analyzed by ANOVA; different superscript letters within grain subgroups indicate significant differences among ED density groups (P <0.05, Tukey’s honestly significant difference comparison).

