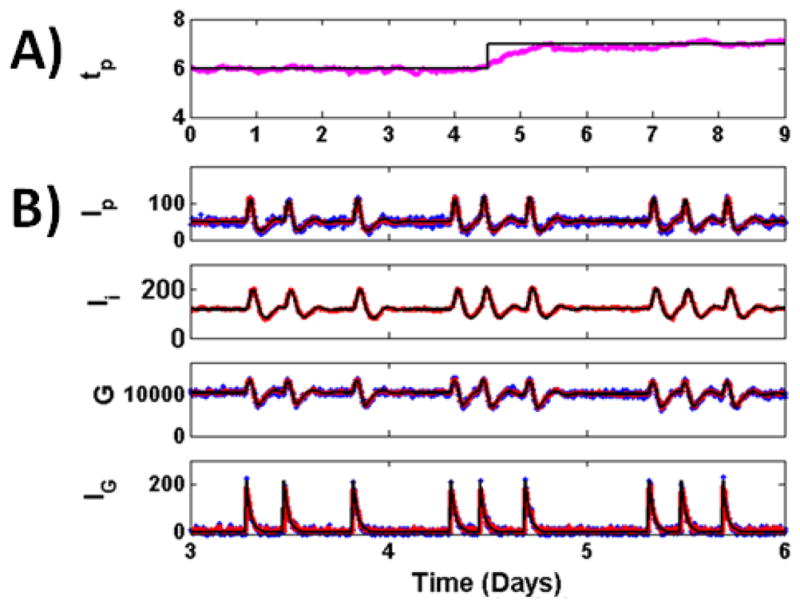
Fig. 3. Parameter Estimation with UKF.

for reconstruction of glucose model from measurements of Ip, G, and IG, sample at 4 minute intervals, with unknown value for parameter tp. Parameter tp used to generate the data (black) abruptly shifts at day 4.5 from a value of 6 to a value of 7, which might reflect a sudden change in kidney function. A) Parameter estimate (magenta) is shown overlapped with the true parameter value used to generate the data (black). The estimated parameter is close to the true value during periods where the parameter has a low value, a high value, and when the parameter undergoes a sudden shift. B) True (black), measured (blue) and reconstructed (red) dynamics for some model variables shown in the 3–6 day period.
