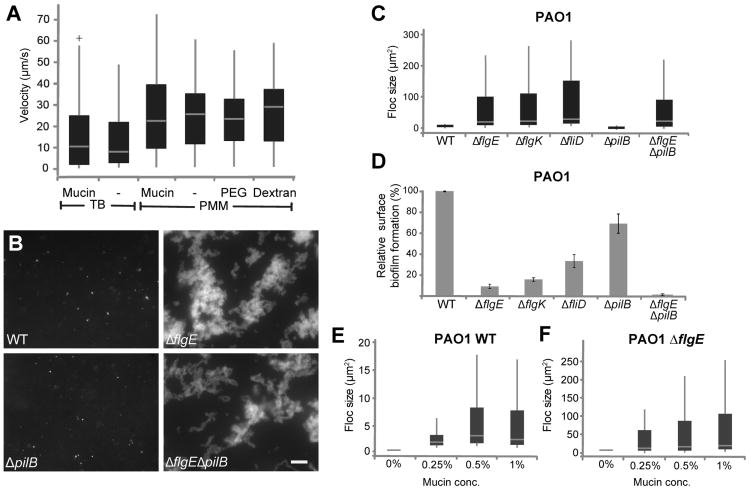
Figure 2. Non-motile flagella mutants, but not their motile counterparts, form flocs in mucin environments.
(A) Boxplots depicting swimming velocities of P. aeruginosa in various conditions. Cells were grown in the media indicated, but swimming experiments were in 50%-strength media. Velocities were obtained from particle tracking analyses of 20-s swimming videos obtained at 20 frames per second. See also Movies S1-S5. (B) Floc formation of wild-type cells, flagella mutant (ΔflgE), a pili mutant (ΔpilB), and double flagella and pili mutant (ΔflgEΔpilB)in PMM with 1% mucins after 20 h of incubation. Images are of cells in suspension only. Scale bar is 20 μm. Boxplots (C, E, F) quantifying floc size of wild type, flagella, pili and matrix and motility mutants for the strains indicated in μm2, after 20 h of growth in 1% mucin (unless otherwise indicated). For details on the quantification method see experimental procedures. For all boxplots, boxes extend from the 25th to the 75th percentile, the central line is the median, and whiskers extend to the data point nearest to 1.5 times the interquartile range above and below the box. Outliers are plotted as plus signs. (D) Surface attached biofilm formation was quantified by crystal violet (CV): liquid cultures of the strains indicated were inoculated in 96-well plates at an OD600 of 0.01, and incubated for 7 h at 37°C. The biofilms that formed were quantified by staining with 0.1% CV as described previously [30]. After staining, each plate was rinsed, and the remaining CV was destained with 33% acetic acid for 15 min. and measured using a plate reader (OD595). Data are presented as percent biofilm formation relative to wild type. The error bars represent standard deviation. See also Fig. S1.

