Figure 2.

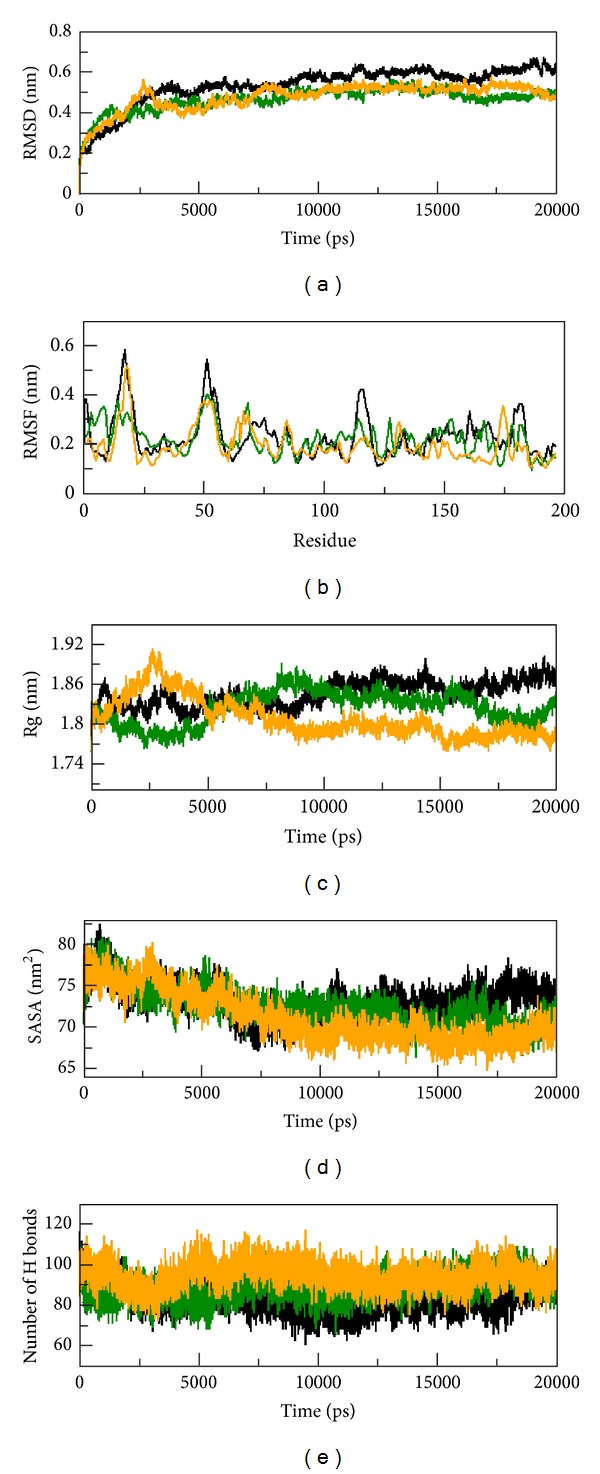
RMSD, RMSF, Rg, SASA, and NH bond of native and mutant Tyrp1 proteins versus time at 300 K. Native is shown in black, mutant (R326H) in green, and mutant (R356Q) in yellow.

RMSD, RMSF, Rg, SASA, and NH bond of native and mutant Tyrp1 proteins versus time at 300 K. Native is shown in black, mutant (R326H) in green, and mutant (R356Q) in yellow.