
Figure 1.
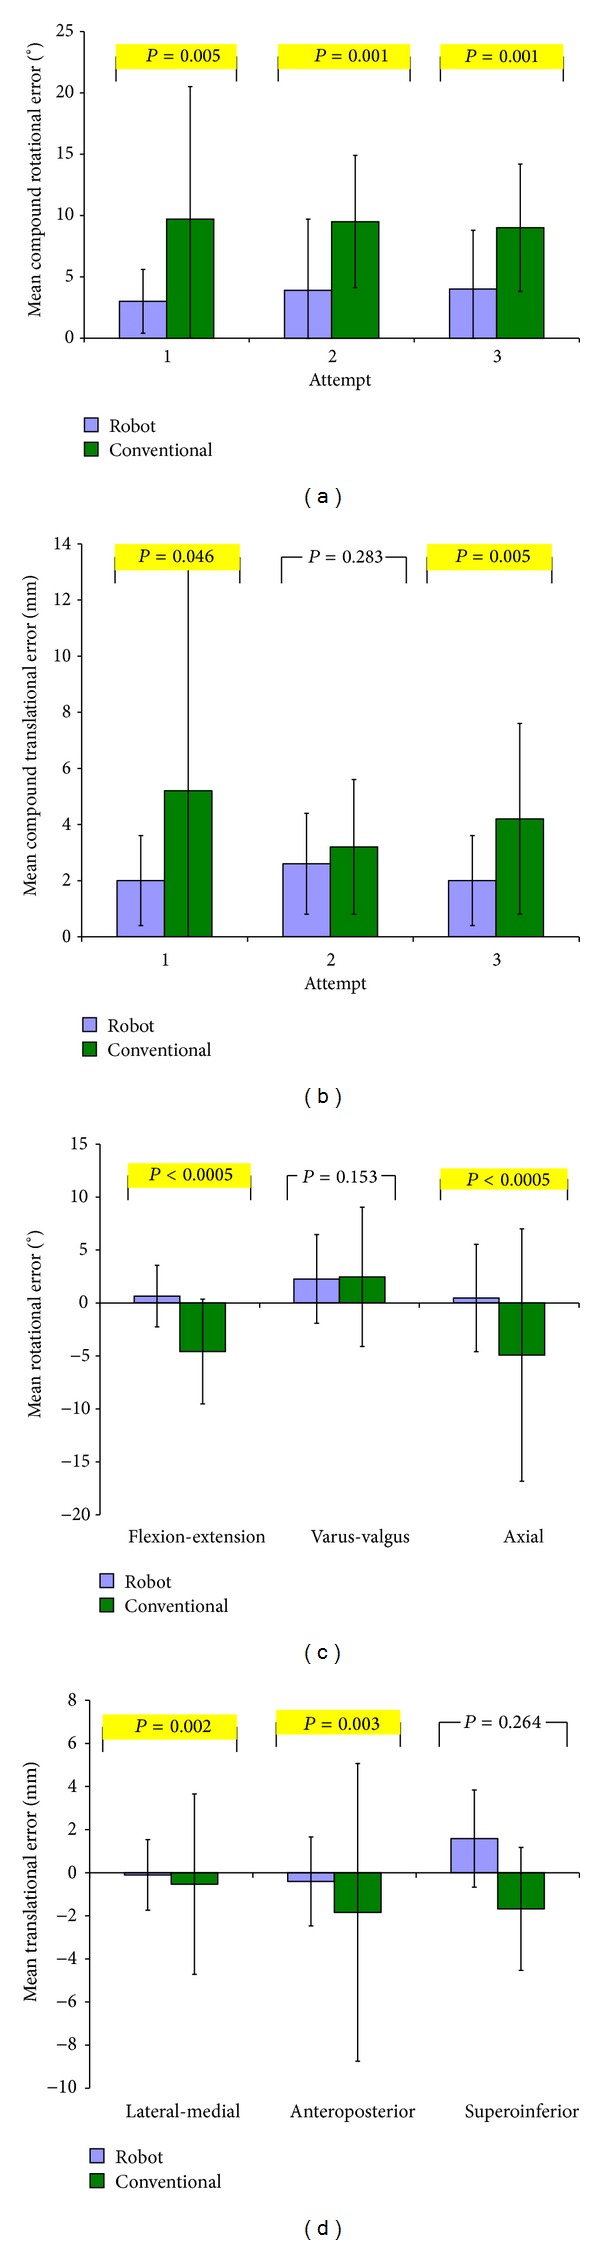
Bar graphs comparing tibial component positioning in robot and conventional groups at attempts 1, 2, and 3 by mean (a) compound rotational error, (b) compound translational error, (c) rotational alignment in each DoF, and (d) translational alignment in each DoF. P values compare mean root mean squared errors between groups.