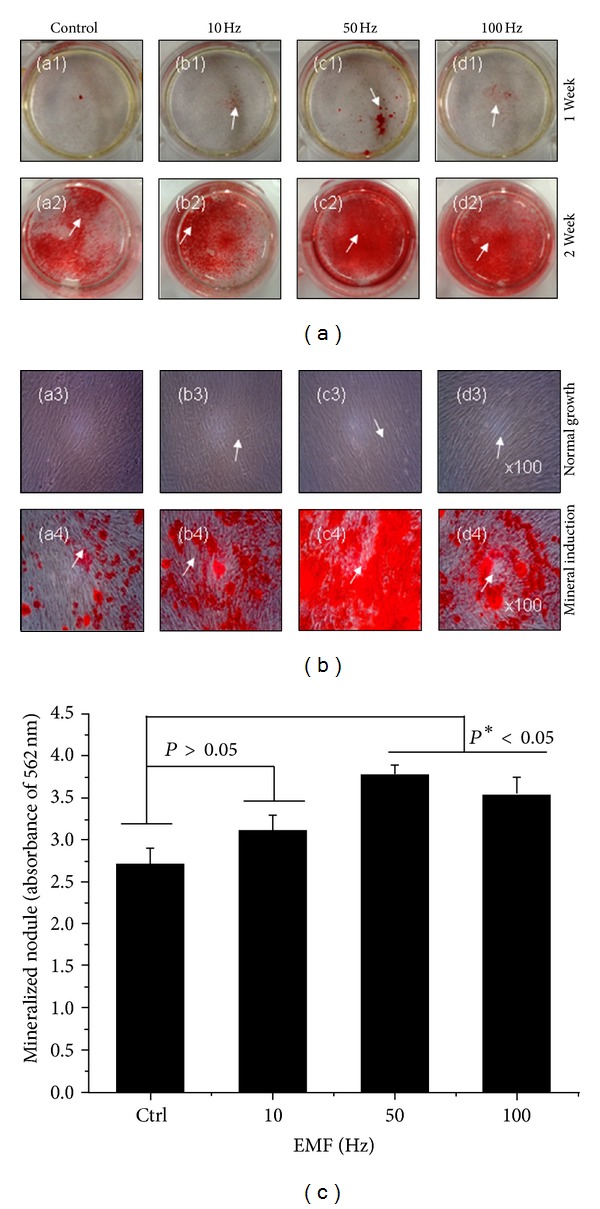
Figure 5.

Representative optical microscopic images of hABMSCs after alizarin red staining treatment with static condition (a1, a2) or ELF-PEMFs (intensity, 6 Gauss) at 10 Hz/day (b1, b2), 50 Hz/day (c1, c2), and 100 Hz/day (d1, d2) at 1 and 2 weeks, respectively. ELF-PEMFs induction groups at 50 and 100 Hz/day were way too much intense compared to control (b, white arrows: mineral nodules stained in red). Mineralized nodule as optical density (absorbance of 562 nm) measured after destaining treatment (c). ELF-PEMFs induction exposed at 50 and 100 Hz/day groups have statistically significant differences (*P < 0.05) among groups (n = 3, bar = 1 mm).
