Figure 8.

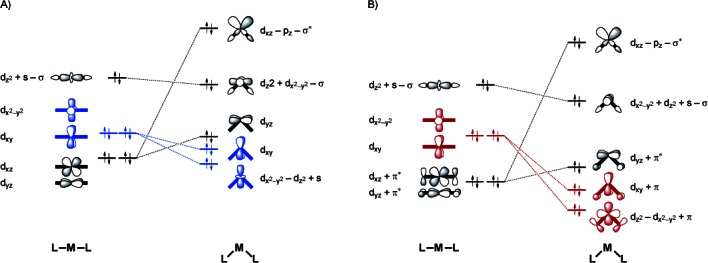
Simplified Walsh diagrams for bending ML2 complexes that emerge from our Kohn–Sham MO analyses (+/− indicate bonding/antibonding) A) without and B) with π backbonding.

Simplified Walsh diagrams for bending ML2 complexes that emerge from our Kohn–Sham MO analyses (+/− indicate bonding/antibonding) A) without and B) with π backbonding.