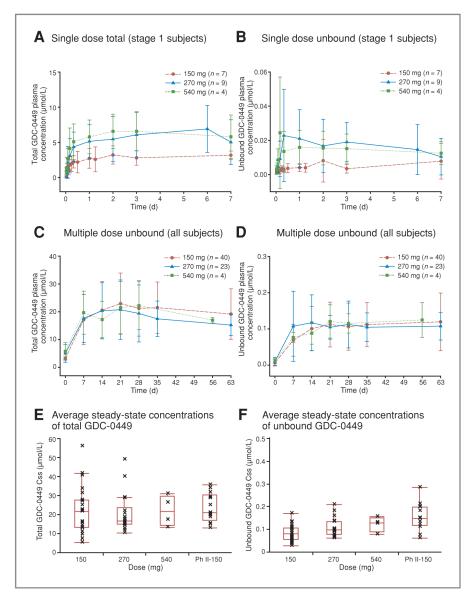
Figure 1.
Pharmacokinetics of GDC-0449 after single- and multiple-dose administration. Plasma concentrations of total (A) and unbound (B) GDC-0449 over time are shown after a single dose and after multiple daily doses (C, total; D, unbound). (For C and D, PK samples from a patient who discontinued from the study early were not collected after the initiation of multiple dosing.) Average steady-state concentrations of total (E) and unbound (F) GDC-0449 in all subjects in the 150, 270, 540, and 150 mg phase II formulation cohorts are also presented. In E and F, The line in the middle of the box represents the median, the top and bottom box limits represent the 25th and 75th percentiles, and the top and bottom bars represent 1.5 times the interquartile range.

