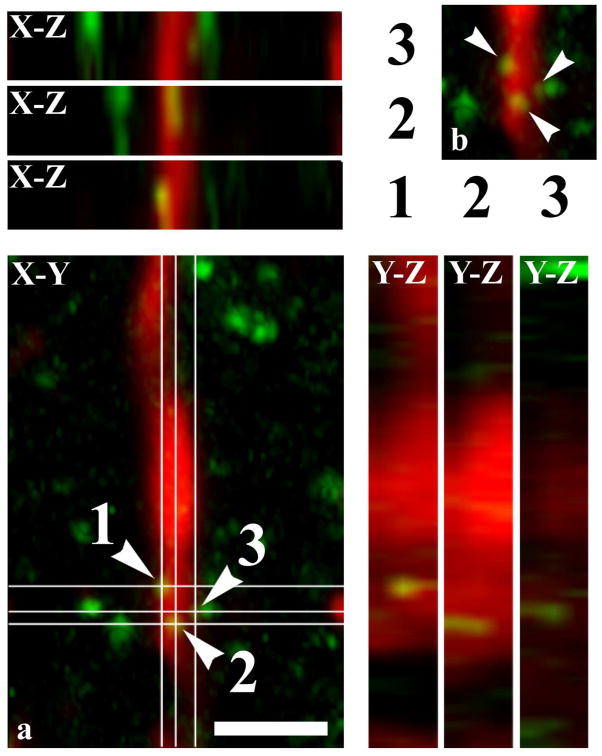
Figure 5.
Co-localization between NAPE-PLD and GFAP illustrated in X-Y, X-Z and Y-Z projections of confocal optical sections. Micrographs of a singe1.6 μm thick laser scanning confocal optical section, shown also in Figure 6i, illustrating X-Y, X-Z and Y-Z projections of the optical section double immunostained for GFAP (red) and NAPE-PLD (green). The points of co-localization between the two markers are at the crossing point of two lines indicating the planes through which orthogonal views of X-Z and Y-Z projections were drawn. The X-Z and Y-Z images of puncta 1, 2, 3 on insert a are identified by the serial numbers of the puncta beside and above the X-Z and Y-Z projections, respectively. Insert b shows a part of insert a (without the lines indicating the planes of the orthogonal views) at the site of the NAPE-PLD immunoreactive puncta. According to the orthogonal images, as it is indicated by the mixed color (yellow), NAPE-PLD immunostained puncta 1 and 2 are within the confines of the GFAP immunoreactive profile (see the mixed color (yellow) on all the three projections). However, in case of immunoreactive punctum 3, although there appears to be some overlap between the two markers indicated by the mixed color (yellow) on the X-Y and X-Z projections, the green color on the Y-Z projectional image clearly shows that the NAPE-PLD immunoreactive punctum is not within but adjacent to the GFAP immunoreactive profile.

