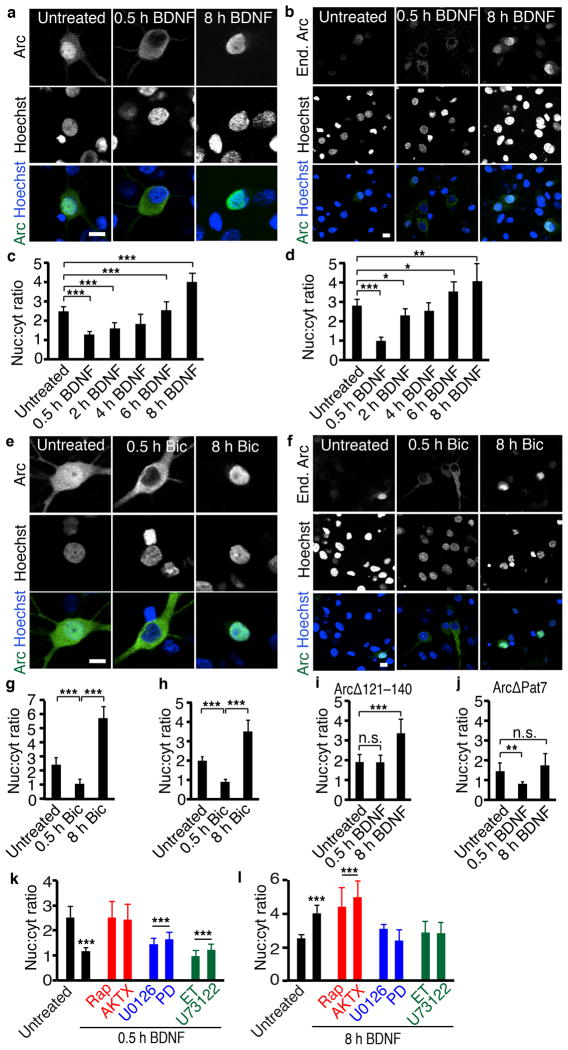
Figure 4. Activity regulates Arc nuclear import and export.
(a, e) Representative images of neurons transfected with Arc and treated with BDNF (a) or bicuculline (Bic) (e).
(c, g) Quantification of Arc expression with BDNF (c) or bicuculline (g). For 0h BDNF N=100, 0.5h N=42, 2h N=51, 4h N=40, 6h N=40, 8h N=102. For Bic 0h N=62, 0.5h N=50, 8h N=41, three biological replicates.
(b, f) Representative images of staining of endogenous Arc in neurons treated with BDNF (b) or bicuculline (f).
(d, h) Quantification of endogenous Arc expression with BDNF (d) or bicuculline (h). For BDNF 0h N=86, 0.5h N=35, 2h N=68, 4h N=35, 6h N=34, 8h N=165. For Bic 0h N=59, 0.5h N=82, 8h N=77, three independent cultures.
(i, j) Quantification of ArcΔ121–140 (i) or ArcΔPat7 (j) expression in response to BDNF. ArcΔ121–140 N=38, ArcΔ121–140+0.5 h BDNF N=40, ArcΔ121–140+8 h BDNF N=29, ArcΔPat7 N=40, ArcΔ Pat7+0.5 h BDNF N=46, ArcΔ Pat7+8 h BDNF N=31 three independent cultures.
(l, m) Quantification of Arc localization with 0.5 (l) or 8 hours (m) of BDNF and inhibitors of downstream pathways. For 0.5h BDNF, control N=49, BDNF N=58, Rap N=40, AKTX N=21, U0126 N=40, PD N=41, ET N=35, U73122 N=31 from three independent cultures. For 8h BDNF, control N=100, BDNF N=102, Rap N=29, AKTX N=33, U0126 N=50, PD N=32, ET N=27, U7 N=30, three independent cultures. *, p<0.05; **, p<0.01; ***, p<0.001 vs untreated, by ANOVA. Error bars show 95% confidence intervals. Scale bars=10 μm.

