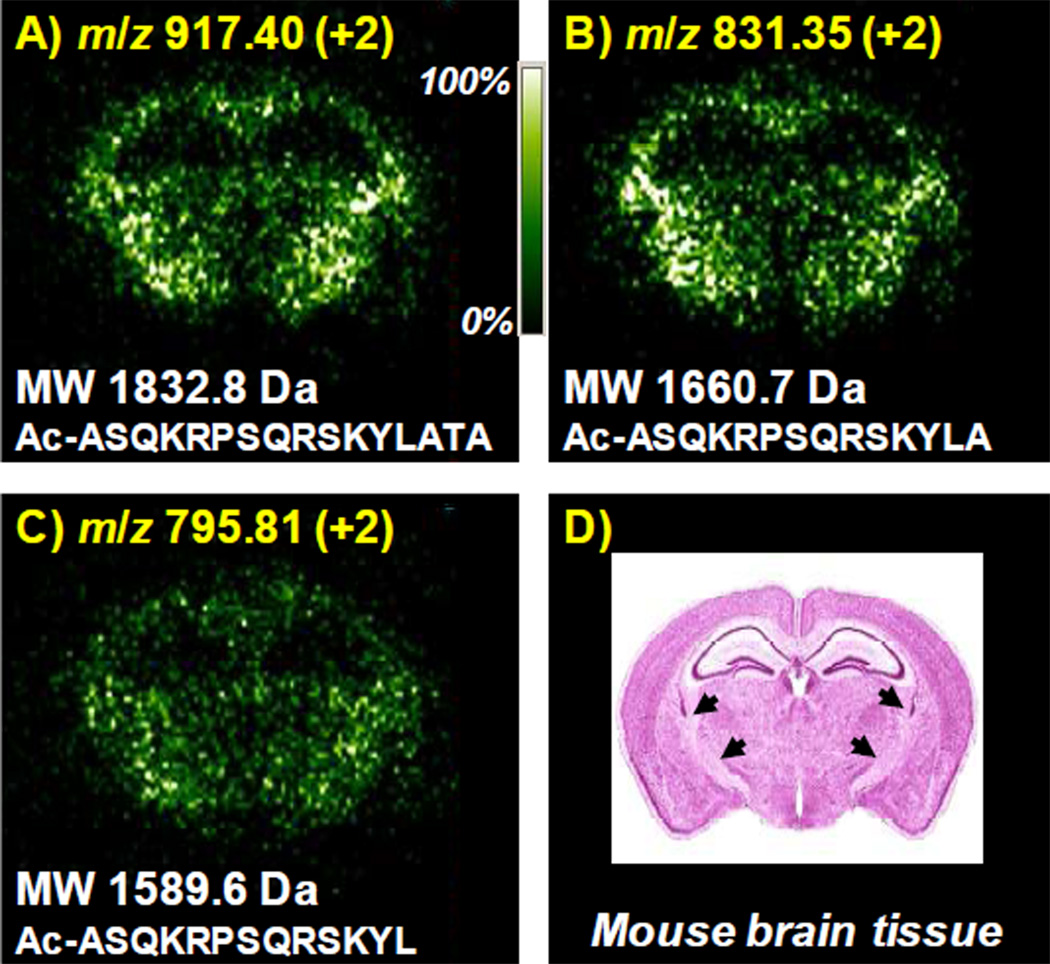
Figure 3.
LSIV at intermediate pressure images of endogenous peptides from delipified mouse brain tissue spray coated with 100% 2-NPG matrix: A) m/z 917.40 (+2) MW 1832.8, B) m/z 831.35 (+2) MW 1660.7, and C) m/z 795.81 (+2) MW 1589.6, and (D) Coronal section of the mouse brain54 at a level similar to those analyzed in A-C. Arrowheads in (D) indicate heavily myelinated fiber tracts. Insets show molecular weight and amino acid sequence of the images relative to the identified peptide MBP fragment. The highest ion intensities are m/z 917 = 1.02 e4, m/z 831 = 1.27 e4, and m/z 795 = 1.06 e4, respectively.

