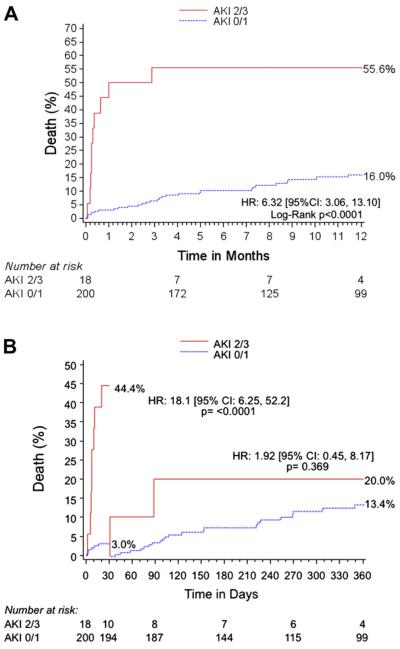
Figure 2.
Kaplan-Meier curves showing cumulative death over time. (A) Comparison of 1-year cumulative rate of death over time between AKI stage 0–1 and AKI stage 2–3. (B) Thirty-day landmark analysis. Most deaths in AKI stage 2–3 group occurred early after TAVR, suggesting the occurrence of a lethal periprocedural complication. CI = confidence interval; HR = hazard ratio.

