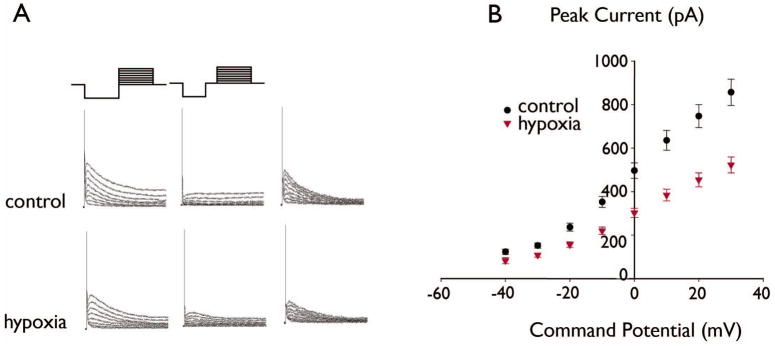
Figure 1. Decreased IA in DGCs after seizure-inducing hypoxia.

Figure 1 shows IA recorded in representative DGCs in slices from a control and hypoxia-treated rat. (A) Raw currents are shown in the left and middle panels, and subtracted currents are shown in the right panels (see Methods). For the cells shown, the peak subtracted amplitude activated at 30 mV was 963 pA for control compared to 608 pA for hypoxia. (B): Summary current-voltage relationships for IA in DGCs from the control and hypoxia-treated groups showed significantly decreased IA amplitudes in the hypoxia-treated group compared to controls (control, n=26; hypoxia, n=38, P<0.0001, ANOVA).
