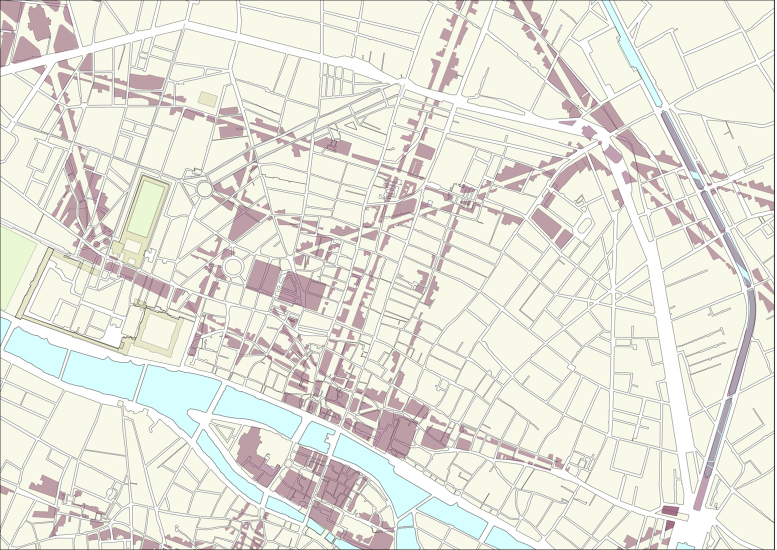
Figure 1. Illustration on a small area of the impact of Haussmann's transformations.
On the yellow background, we show the parcel distribution before Haussmann (extracted from the Vasserot cadastre, 1808–1836), and in brown we show the new buildings delineating the new streets as designed by Haussmann and as they appeared in 1888. We can see on this example that the Haussmann plan implied a large number of destruction and rebuilding: approximately 28, 000 houses were destroyed and 100, 000 were built25 (figure created from authors' data with QuantumGIS software: www.qgis.org).

