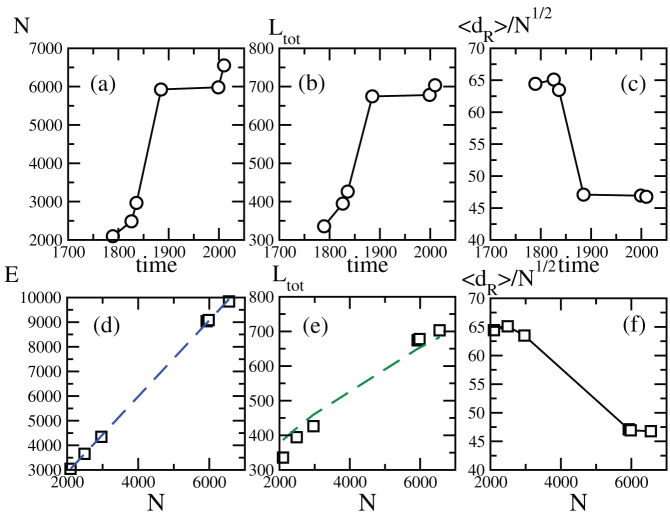
Figure 3.
Top panels: Number of (a) nodes, (b) total length (kms), and (c) rescaled average route distance versus time.Bottom panels: Number of (d) edges, (e) total length (kms), and (f) the rescaled average route distance versus the number of nodes N. In (d) the dashed (blue) line is a linear fit with slope 1.55 (r2 = 0.99) consistent with constant average degree of order 〈k〉 ≈ 3, and in (e) the dashed (green) line a square root fit of the form  with a = 8.44 kms (r2 = 0.99). Based on a perturbed lattice picture this gives an area equal to
  consistent with the actual value (A = 33.6 km2). In (f), we show the rescaled average shortest route versus N which decreases showing that the denser the network and the easier it is to navigate from one node to the other (if delays at junctions are neglected).

