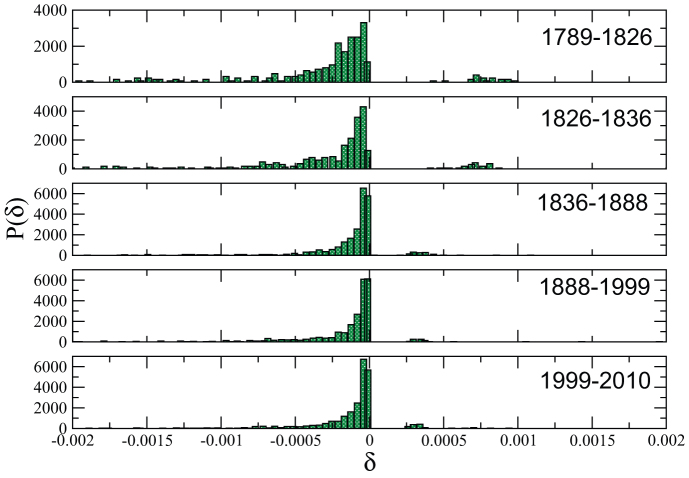
Figure 4. Betweenness centrality impact distribution for the periods 1789 → 1826, 1826 → 1836, 1836 → 1888, 1888 → 1999, 1999 → 2010.
This figure shows that densification is the main process for this portion of Paris and that from this point of view, the Haussmann period seems to be rather smooth and comparable to other periods.

