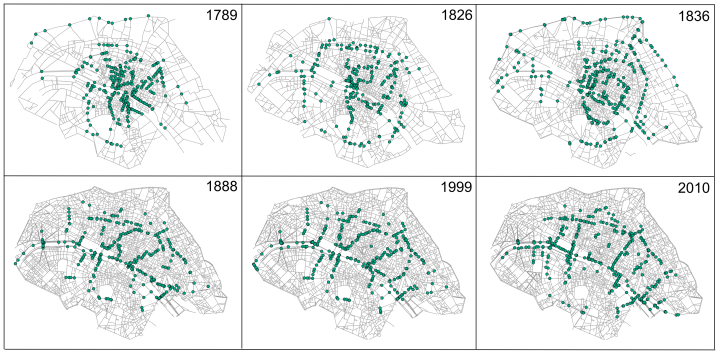
Figure 5. Spatial distribution of the most central nodes (with centrality gv such that gv > max gv/10).
We observe for the different periods important reorganizations of the spatial distribution of centrality, corresponding to different specific interventions. In particular, we observe a very important redistribution of centrality during the Haussmann period with the appearance of a reticulated structure on the 1888 map.

