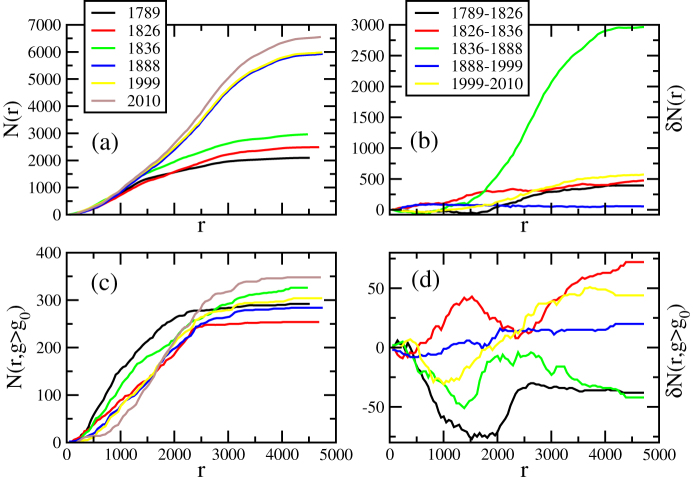
Figure 6. Top panels: (a) number of nodes in a disk of radius r from the barycenter of Paris and (b) its variation versus r.
As expected the largest variation occurred during the Haussmann period. Bottom panels: (c) Number of nodes at distance r and with centrality larger than g0 (g0 = max gv/10) and (d) its variation. The thick green line in the right panels indicate the Haussmann transition 1836–1888. We see here that during the Haussmann period (and also in the 1789–1826 period), there is a large decrease of the number of central nodes in the central region of Paris (r < 2,000 meters).

