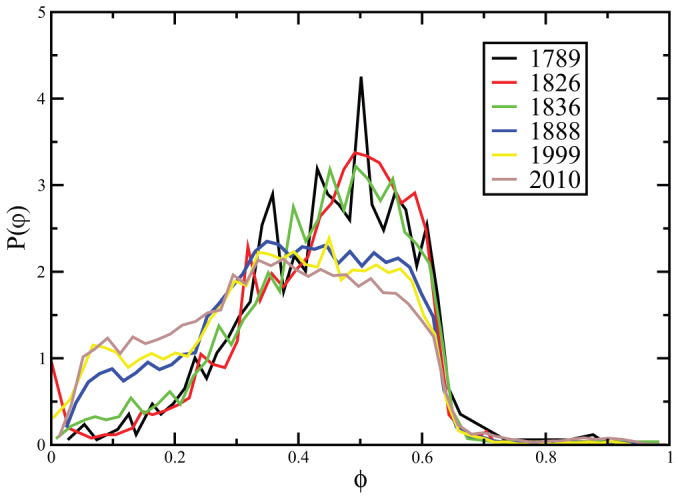
Figure 7. Probability distribution of the φ shape factor for the blocks at different years.

Until 1836, this distribution is stable and we observe a dramatical change during the Haussmann period with a larger abundance of blocks with small value of φ. These small values correspond to elongated rectangle or triangles created by streets crossing the existing geometry at various angles.
