
Figure 8. Radial representation of the angle distribution of road segments for 1789, 1826, 1836, 1888.
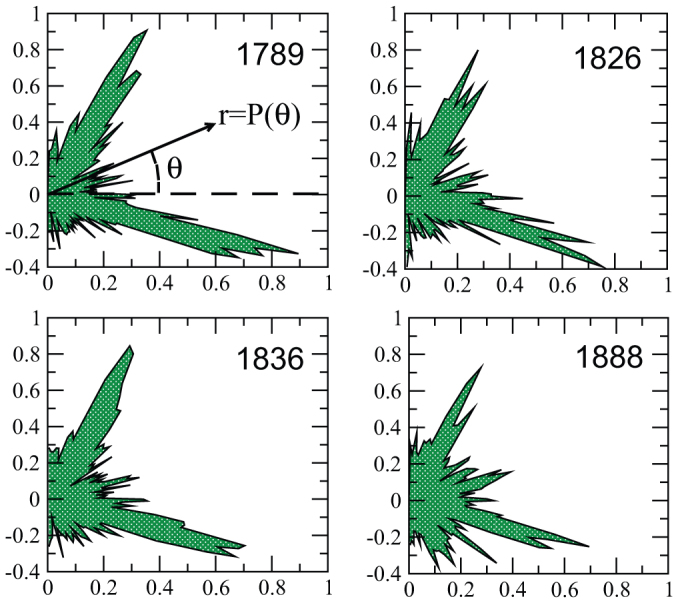
The radial distance r in this plot represents the probability to observe a street with angle θ: r = P(θ) with θ ∈ [−π/2, π/2] and P(θ) is the probability to observe an oriented road with angle θ with the horizontal line (see first panel, top left). Until 1836, the distribution is peaked around two values separated by approximately 90 degrees and in 1888, we observe an important fraction of diagonals and other lines at intermediate angles.