
Figure 2.
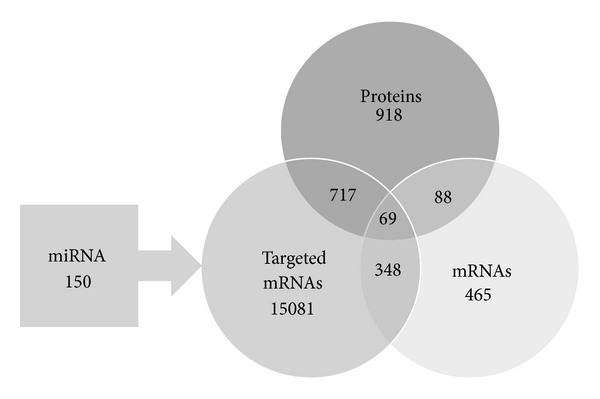
Results and relations of mRNA microarray, miRNA microarray, and stable-isotope dimethyl labeling for quantitative proteomics. Only molecules from the omics datasets that met the expression fold change cutoff of ≥±1.2 are shown in this diagram. The intersections of the Venn diagram indicate the number of corresponding molecules deregulated in different assays independently from the direction of their deregulated expression.